| Red | Green | Blue | |
| z | 17.64 | ||
| znorm | Inf | ||
| sky | -Inf | -Inf | -Inf |
| S/N | 30.1 | 53.4 | 57.5 |
| S/N(c) | 0.0 | 0.0 | 0.0 |
| SN(E/C) |
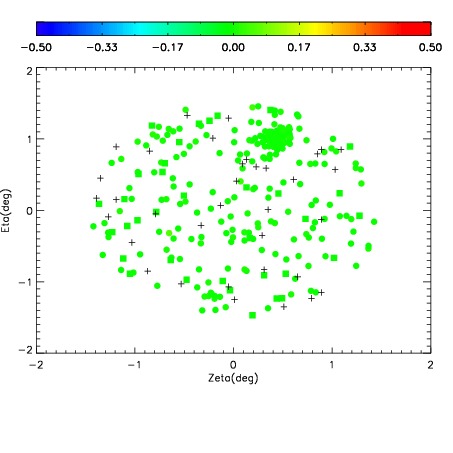
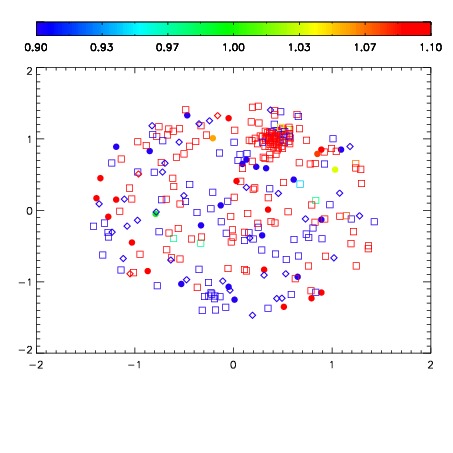
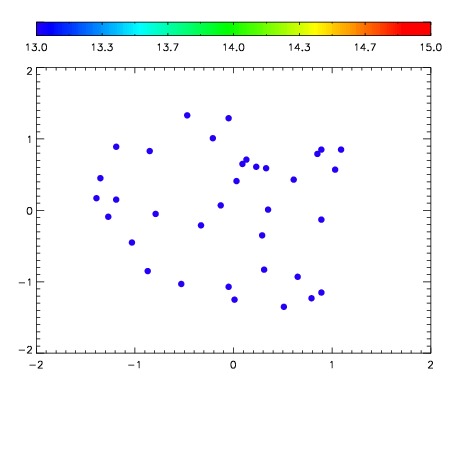

| Frame | Nreads | Zeropoints | Mag plots | Spatial mag deviation | Spatial sky 16325A emission deviations (filled: sky, open: star) | Spatial sky continuum emission | Spatial sky telluric CO2 absorption deviations (filled: H < 10) | |||||||||||||||||||||||
| 0 | 0 |
|
|
|
|
|
|
| IPAIR | NAME | SHIFT | NEWSHIFT | S/N | NAME | SHIFT | NEWSHIFT | S/N |
| 0 | 14970105 | 0.000690125 | 0.00000 | 19.1146 | 14970106 | -0.501092 | 0.501782 | 19.0973 |
| 1 | 14970101 | -0.00170283 | 0.00239295 | 19.0873 | 14970102 | -0.501421 | 0.502111 | 19.0874 |
| 2 | 14970100 | -0.00205825 | 0.00274837 | 19.0682 | 14970099 | -0.502451 | 0.503141 | 19.0810 |
| 3 | 14970104 | 0.000158746 | 0.000531379 | 19.0554 | 14970103 | -0.501435 | 0.502125 | 19.0772 |
| 4 | 14970097 | 0.00000 | 0.000690125 | 19.0408 | 14970098 | -0.502171 | 0.502861 | 19.0581 |