| Red | Green | Blue | |
| z | 17.64 | ||
| znorm | 13.46 | ||
| sky | 20.4 | 19.6 | 21.1 |
| S/N | 14.6 | 25.4 | 27.5 |
| S/N(c) | 0.0 | 0.0 | 0.0 |
| SN(E/C) |
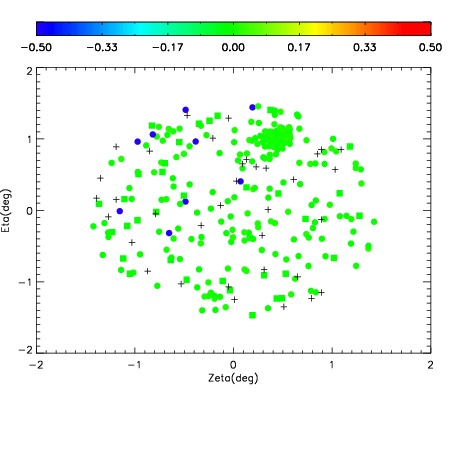
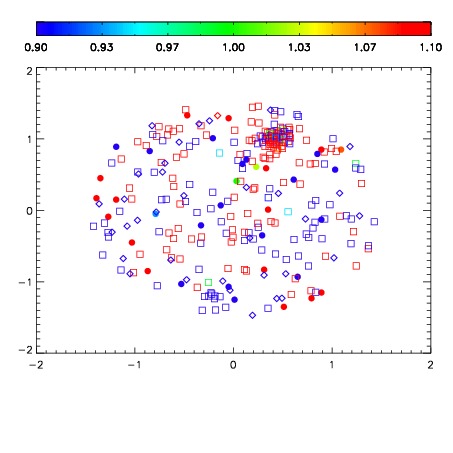
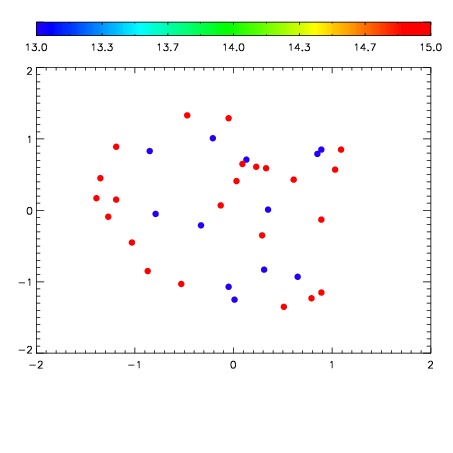

| Frame | Nreads | Zeropoints | Mag plots | Spatial mag deviation | Spatial sky 16325A emission deviations (filled: sky, open: star) | Spatial sky continuum emission | Spatial sky telluric CO2 absorption deviations (filled: H < 10) | |||||||||||||||||||||||
| 0 | 47 |
|
|
|
|
|
|
| IPAIR | NAME | SHIFT | NEWSHIFT | S/N | NAME | SHIFT | NEWSHIFT | S/N |
| 0 | 15000071 | 0.498550 | 0.00000 | 19.1792 | 15000070 | 0.00000 | 0.498550 | 19.1752 |