| Red | Green | Blue | |
| z | 17.65 | ||
| znorm | Inf | ||
| sky | -Inf | -Inf | -Inf |
| S/N | 4.2 | 8.5 | 9.5 |
| S/N(c) | 0.0 | 0.0 | 0.0 |
| SN(E/C) |
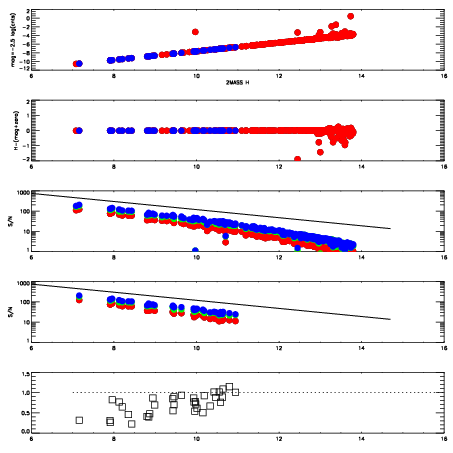

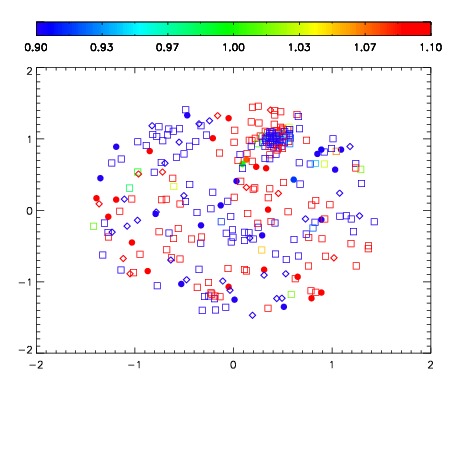
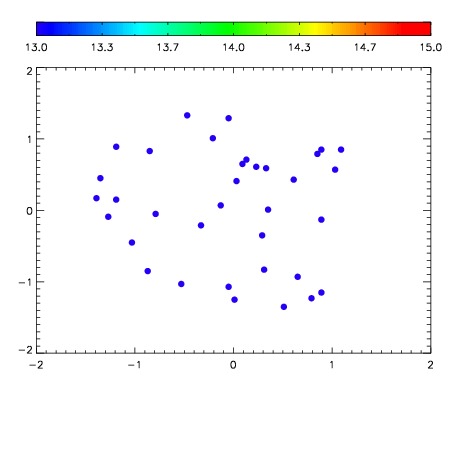

| Frame | Nreads | Zeropoints | Mag plots | Spatial mag deviation | Spatial sky 16325A emission deviations (filled: sky, open: star) | Spatial sky continuum emission | Spatial sky telluric CO2 absorption deviations (filled: H < 10) | |||||||||||||||||||||||
| 0 | 0 |
|
|
|
|
|
|
| IPAIR | NAME | SHIFT | NEWSHIFT | S/N | NAME | SHIFT | NEWSHIFT | S/N |
| 0 | 15320032 | 0.496326 | 0.00000 | 16.2029 | 15320026 | 0.00000 | 0.496326 | 15.7971 |
| 1 | 15320027 | 0.494627 | 0.00169900 | 17.1798 | 15320033 | 0.00219203 | 0.494134 | 17.4717 |
| 2 | 15320028 | 0.496176 | 0.000149995 | 16.2196 | 15320029 | 0.00123921 | 0.495087 | 16.5609 |
| 3 | 15320031 | 0.495765 | 0.000560999 | 15.9013 | 15320030 | 0.00196217 | 0.494364 | 15.6895 |