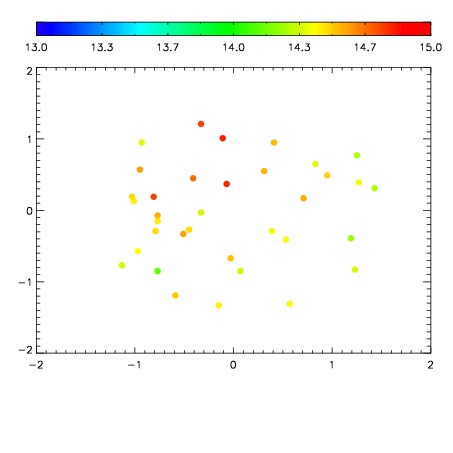
| Frame | Nreads | Zeropoints | Mag plots
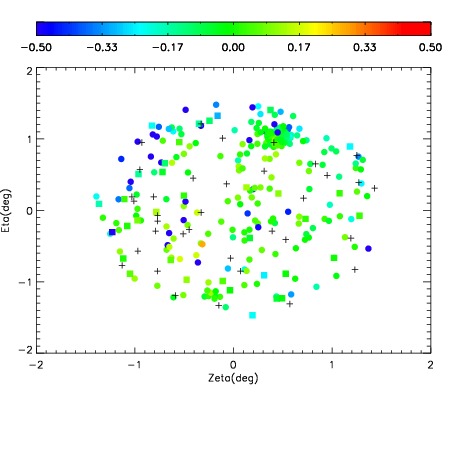
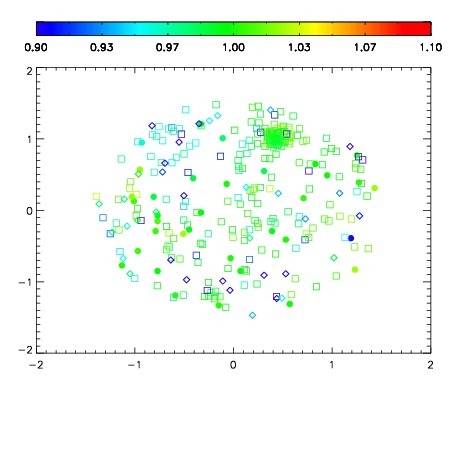
| Spatial mag deviation
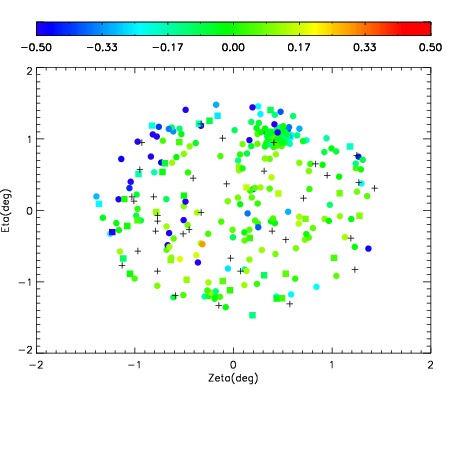
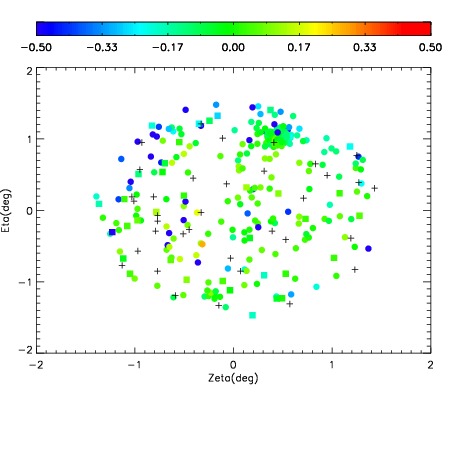
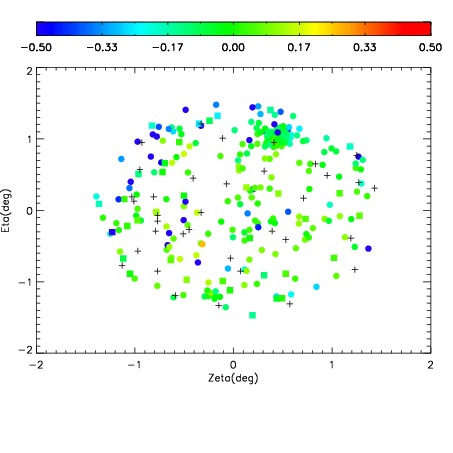
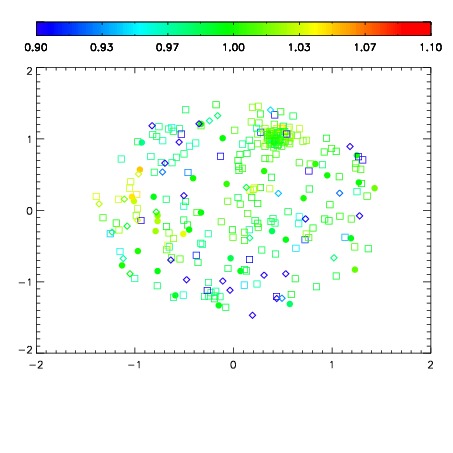
| Spatial sky 16325A emission deviations (filled: sky, open: star)
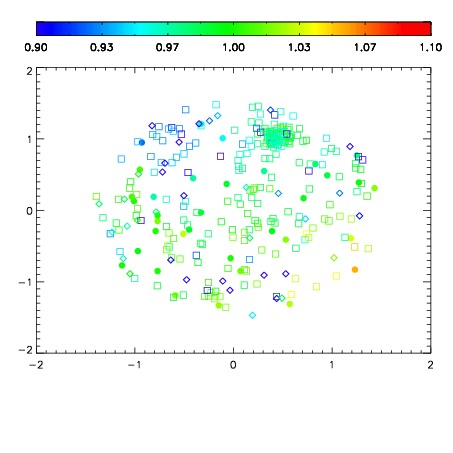
| Spatial sky continuum emission
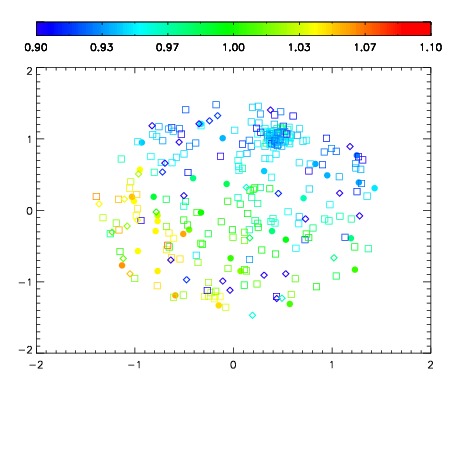
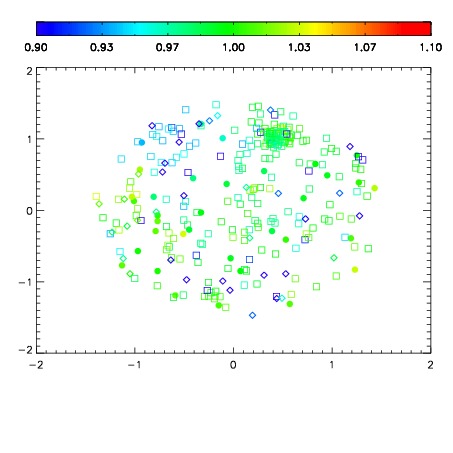
| Spatial sky telluric CO2 absorption deviations (filled: H < 10)
|
| 14980082
| 47
| | Red | Green | Blue
| | z | | 19.00
| | znorm | | 14.82
| | sky | 14.5 | 14.3 | 14.6
| | S/N | 15.6 | 26.1 | 27.8
| | S/N(c) | 27.0 | 57.9 | 24.4
| | SN(E/C) 0.42
|
| 
| 
| 
| 
| 
|
| 14980083
| 47
| | Red | Green | Blue
| | z | | 18.99
| | znorm | | 14.81
| | sky | 14.6 | 14.4 | 14.6
| | S/N | 15.4 | 25.5 | 28.1
| | S/N(c) | 26.0 | 58.2 | 24.4
| | SN(E/C) 0.43
|
| 
| 
| 
| 
| 
|
| 14980084
| 47
| | Red | Green | Blue
| | z | | 19.07
| | znorm | | 14.89
| | sky | 14.7 | 14.5 | 14.7
| | S/N | 15.8 | 26.7 | 28.5
| | S/N(c) | 27.3 | 60.2 | 24.9
| | SN(E/C) 0.41
|
| 
| 
| 
| 
| 
|
| 14980085
| 47
| | Red | Green | Blue
| | z | | 19.05
| | znorm | | 14.87
| | sky | 14.7 | 14.6 | 14.7
| | S/N | 15.5 | 26.3 | 28.3
| | S/N(c) | 26.8 | 59.9 | 24.8
| | SN(E/C) 0.44
|
| 
| 
| 
| 
| 
|
| 14980086
| 47
| | Red | Green | Blue
| | z | | 19.09
| | znorm | | 14.91
| | sky | 14.7 | 14.6 | 14.8
| | S/N | 16.0 | 26.9 | 29.1
| | S/N(c) | 27.5 | 61.4 | 25.4
| | SN(E/C) 0.41
|
| 
| 
| 
| 
| 
|
| 14980087
| 47
| | Red | Green | Blue
| | z | | 19.09
| | znorm | | 14.91
| | sky | 14.9 | 14.7 | 14.8
| | S/N | 16.1 | 27.1 | 29.2
| | S/N(c) | 27.2 | 61.2 | 25.3
| | SN(E/C) 0.42
|
| 
| 
| 
| 
| 
|