| Red | Green | Blue | |
| z | 17.64 | ||
| znorm | Inf | ||
| sky | -NaN | -NaN | -Inf |
| S/N | 24.3 | 44.1 | 46.4 |
| S/N(c) | 0.0 | 0.0 | 0.0 |
| SN(E/C) |
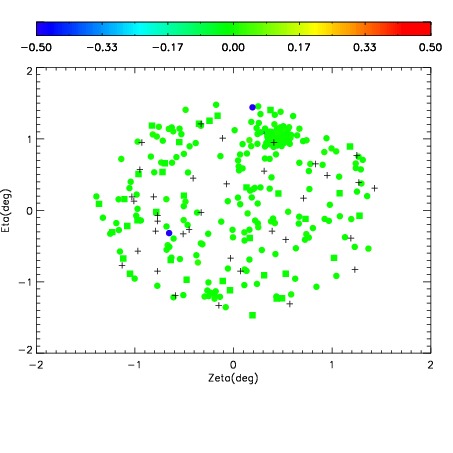
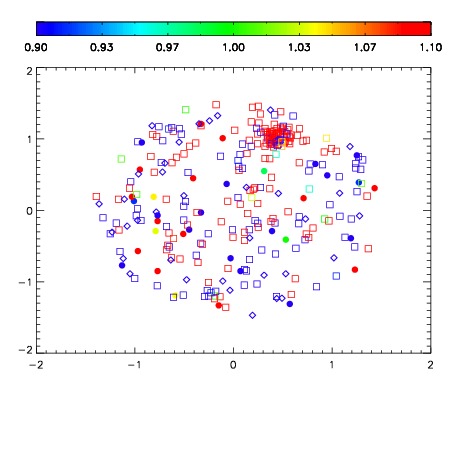
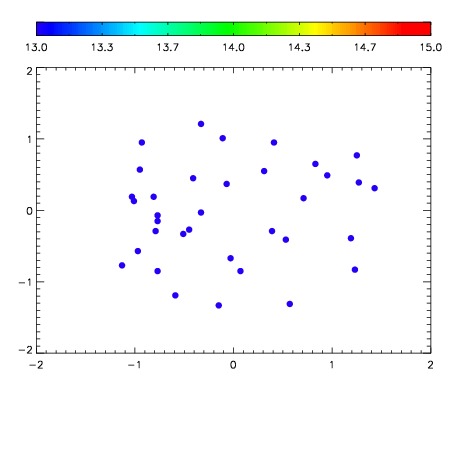

| Frame | Nreads | Zeropoints | Mag plots | Spatial mag deviation | Spatial sky 16325A emission deviations (filled: sky, open: star) | Spatial sky continuum emission | Spatial sky telluric CO2 absorption deviations (filled: H < 10) | |||||||||||||||||||||||
| 0 | 0 |
|
|
|
|
|
|
| IPAIR | NAME | SHIFT | NEWSHIFT | S/N | NAME | SHIFT | NEWSHIFT | S/N |
| 0 | 14980087 | 0.500321 | 0.00000 | 19.0768 | 14980086 | 0.000975371 | 0.499346 | 19.0828 |
| 1 | 14980084 | 0.498604 | 0.00171697 | 19.0651 | 14980085 | 0.000665523 | 0.499655 | 19.0354 |
| 2 | 14980083 | 0.498554 | 0.00176698 | 19.0048 | 14980082 | 0.00000 | 0.500321 | 19.0094 |