| Red | Green | Blue | |
| z | 17.64 | ||
| znorm | Inf | ||
| sky | -NaN | -NaN | -NaN |
| S/N | 30.1 | 53.0 | 55.7 |
| S/N(c) | 0.0 | 0.0 | 0.0 |
| SN(E/C) |
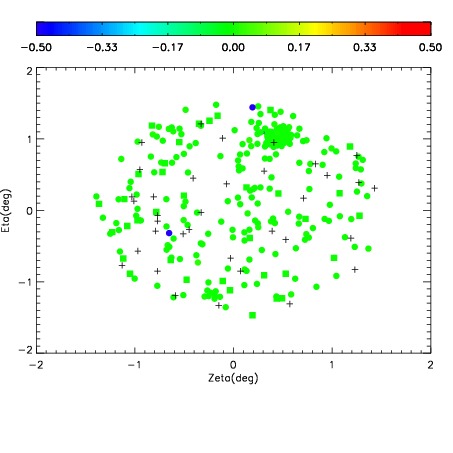
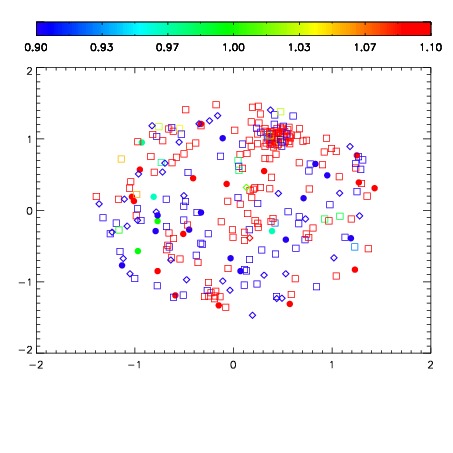


| Frame | Nreads | Zeropoints | Mag plots | Spatial mag deviation | Spatial sky 16325A emission deviations (filled: sky, open: star) | Spatial sky continuum emission | Spatial sky telluric CO2 absorption deviations (filled: H < 10) | |||||||||||||||||||||||
| 0 | 0 |
|
|
|
|
|
|
| IPAIR | NAME | SHIFT | NEWSHIFT | S/N | NAME | SHIFT | NEWSHIFT | S/N |
| 0 | 15010061 | 0.000191989 | 0.00000 | 19.1412 | 15010059 | -0.501051 | 0.501243 | 19.1489 |
| 1 | 15010064 | -7.48930e-05 | 0.000266882 | 19.1682 | 15010063 | -0.501831 | 0.502023 | 19.1664 |
| 2 | 15010057 | 0.00000 | 0.000191989 | 19.1511 | 15010058 | -0.501063 | 0.501255 | 19.1555 |
| 3 | 15010060 | -0.000563108 | 0.000755097 | 19.1508 | 15010062 | -0.501414 | 0.501606 | 19.1516 |