| Red | Green | Blue | |
| z | 17.64 | ||
| znorm | Inf | ||
| sky | -Inf | -NaN | -NaN |
| S/N | 31.9 | 55.4 | 62.0 |
| S/N(c) | 0.0 | 0.0 | 0.0 |
| SN(E/C) |
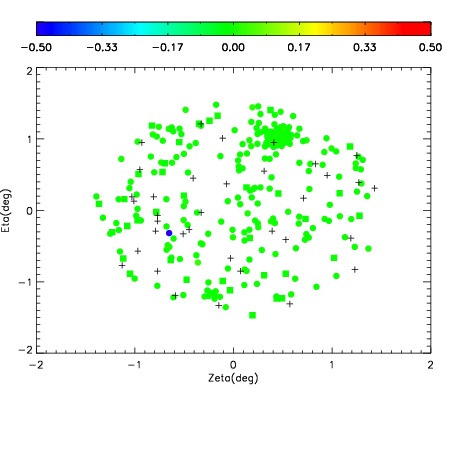
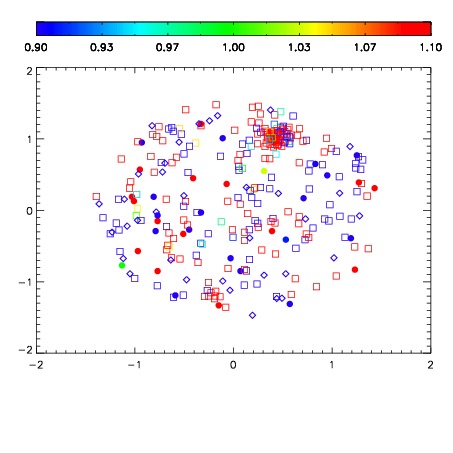


| Frame | Nreads | Zeropoints | Mag plots | Spatial mag deviation | Spatial sky 16325A emission deviations (filled: sky, open: star) | Spatial sky continuum emission | Spatial sky telluric CO2 absorption deviations (filled: H < 10) | |||||||||||||||||||||||
| 0 | 0 |
|
|
|
|
|
|
| IPAIR | NAME | SHIFT | NEWSHIFT | S/N | NAME | SHIFT | NEWSHIFT | S/N |
| 0 | 15310069 | 0.496342 | 0.00000 | 19.1785 | 15310066 | 0.000116347 | 0.496226 | 19.1526 |
| 1 | 15310068 | 0.496090 | 0.000252008 | 19.1827 | 15310070 | 0.000575850 | 0.495766 | 19.1742 |
| 2 | 15310065 | 0.495669 | 0.000672996 | 19.1467 | 15310067 | 0.000344506 | 0.495997 | 19.1459 |
| 3 | 15310064 | 0.496118 | 0.000223994 | 19.1278 | 15310063 | 0.00000 | 0.496342 | 19.1405 |
| 4 | 15310072 | 0.495671 | 0.000670999 | 19.0009 | 15310071 | 0.000803017 | 0.495539 | 19.0866 |