| Red | Green | Blue | |
| z | 17.64 | ||
| znorm | Inf | ||
| sky | -Inf | -Inf | -NaN |
| S/N | 25.8 | 40.7 | 50.6 |
| S/N(c) | 0.0 | 0.0 | 0.0 |
| SN(E/C) |
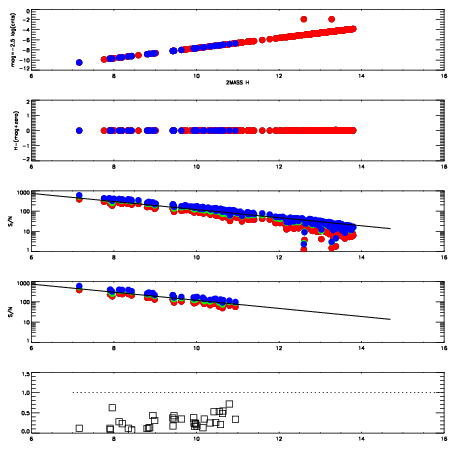
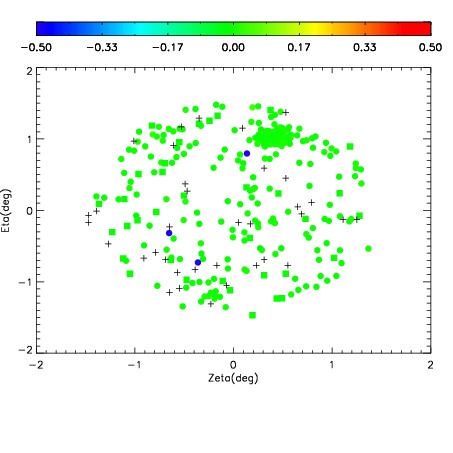
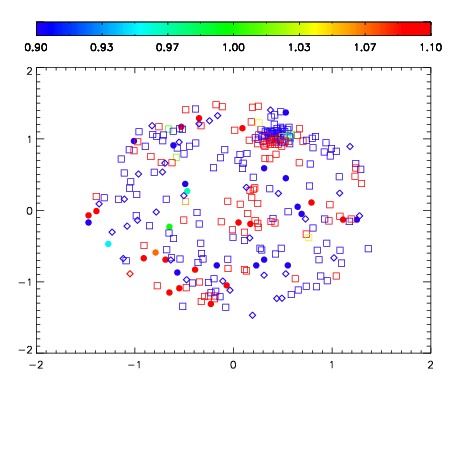


| Frame | Nreads | Zeropoints | Mag plots | Spatial mag deviation | Spatial sky 16325A emission deviations (filled: sky, open: star) | Spatial sky continuum emission | Spatial sky telluric CO2 absorption deviations (filled: H < 10) | |||||||||||||||||||||||
| 0 | 0 |
|
|
|
|
|
|
| IPAIR | NAME | SHIFT | NEWSHIFT | S/N | NAME | SHIFT | NEWSHIFT | S/N |
| 0 | 15520072 | 0.491469 | 0.00000 | 18.8451 | 15520074 | 0.000419389 | 0.491050 | 18.9016 |
| 1 | 15520076 | 0.490378 | 0.00109100 | 19.0067 | 15520077 | -0.000742337 | 0.492211 | 18.9721 |
| 2 | 15520075 | 0.489729 | 0.00174001 | 18.9073 | 15520070 | 0.00000 | 0.491469 | 18.9357 |
| 3 | 15520071 | 0.491131 | 0.000337988 | 18.8657 | 15520073 | -5.33008e-05 | 0.491522 | 18.9282 |