| Red | Green | Blue | |
| z | 17.64 | ||
| znorm | Inf | ||
| sky | -Inf | -Inf | -NaN |
| S/N | 25.3 | 45.4 | 50.4 |
| S/N(c) | 0.0 | 0.0 | 0.0 |
| SN(E/C) |
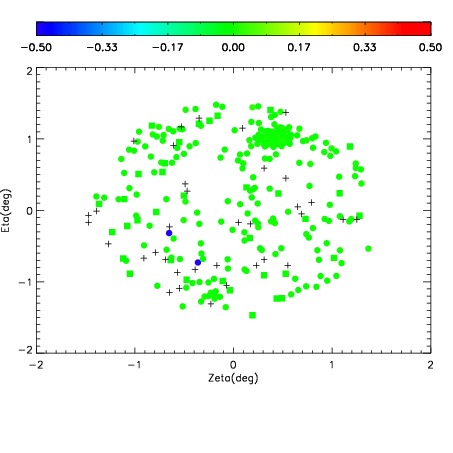
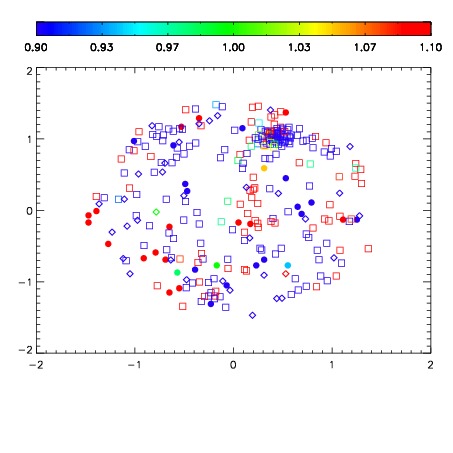
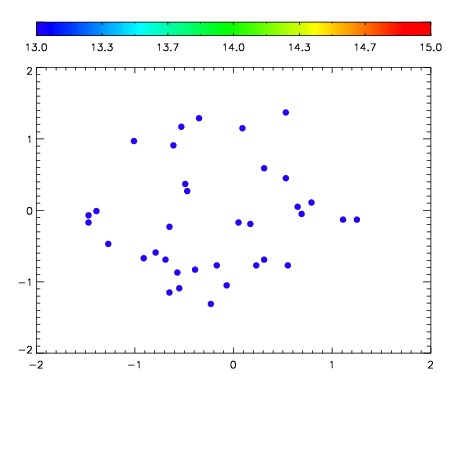

| Frame | Nreads | Zeropoints | Mag plots | Spatial mag deviation | Spatial sky 16325A emission deviations (filled: sky, open: star) | Spatial sky continuum emission | Spatial sky telluric CO2 absorption deviations (filled: H < 10) | |||||||||||||||||||||||
| 0 | 0 |
|
|
|
|
|
|
| IPAIR | NAME | SHIFT | NEWSHIFT | S/N | NAME | SHIFT | NEWSHIFT | S/N |
| 0 | 15570076 | 0.490300 | 0.00000 | 19.0298 | 15570077 | 0.000612961 | 0.489687 | 19.0142 |
| 1 | 15570071 | 0.489851 | 0.000449002 | 19.0521 | 15570070 | 0.00000 | 0.490300 | 19.0184 |
| 2 | 15570075 | 0.490048 | 0.000252008 | 18.9865 | 15570073 | 0.00167267 | 0.488627 | 19.0118 |
| 3 | 15570072 | 0.489768 | 0.000532001 | 18.9495 | 15570074 | 0.00170433 | 0.488596 | 18.9117 |