| Red | Green | Blue | |
| z | 17.64 | ||
| znorm | Inf | ||
| sky | -NaN | -NaN | -NaN |
| S/N | 20.2 | 35.6 | 39.1 |
| S/N(c) | 31.3 | 8.5 | 18.7 |
| SN(E/C) |
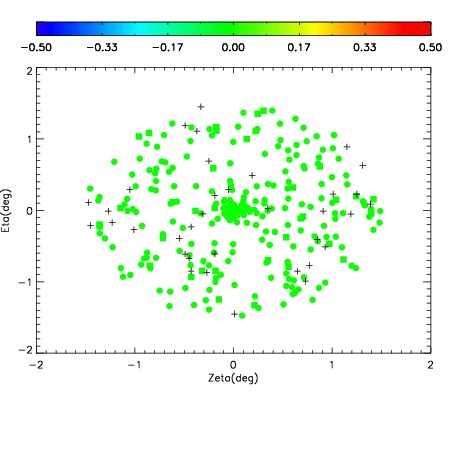
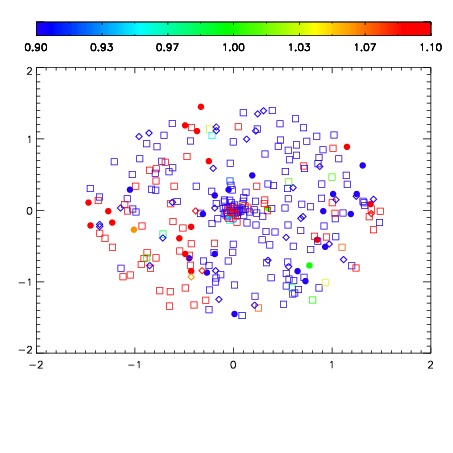
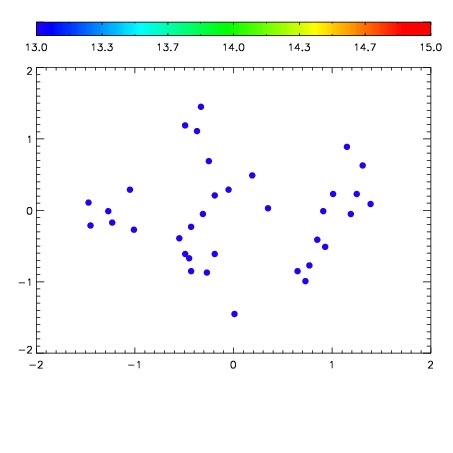

| Frame | Nreads | Zeropoints | Mag plots | Spatial mag deviation | Spatial sky 16325A emission deviations (filled: sky, open: star) | Spatial sky continuum emission | Spatial sky telluric CO2 absorption deviations (filled: H < 10) | |||||||||||||||||||||||
| 0 | 0 |
|
|
|
|
|
|
| IPAIR | NAME | SHIFT | NEWSHIFT | S/N | NAME | SHIFT | NEWSHIFT | S/N |
| 0 | 15250098 | 0.510449 | 0.00000 | 18.1694 | 15250099 | 0.00160647 | 0.508843 | 17.5350 |
| 1 | 15250093 | 0.508629 | 0.00181997 | 18.9277 | 15250096 | 0.00150578 | 0.508943 | 18.9409 |
| 2 | 15250094 | 0.509469 | 0.000980020 | 18.9151 | 15250095 | 0.00130168 | 0.509147 | 18.9370 |
| 3 | 15250097 | 0.509928 | 0.000521004 | 18.6205 | 15250092 | 0.00000 | 0.510449 | 18.8468 |