| Red | Green | Blue | |
| z | 17.64 | ||
| znorm | Inf | ||
| sky | -NaN | -NaN | -NaN |
| S/N | 26.7 | 47.2 | 50.0 |
| S/N(c) | 40.4 | 10.8 | 24.0 |
| SN(E/C) |

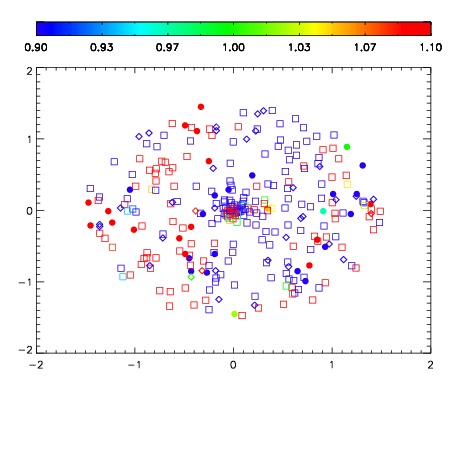


| Frame | Nreads | Zeropoints | Mag plots | Spatial mag deviation | Spatial sky 16325A emission deviations (filled: sky, open: star) | Spatial sky continuum emission | Spatial sky telluric CO2 absorption deviations (filled: H < 10) | |||||||||||||||||||||||
| 0 | 0 |
|
|
|
|
|
|
| IPAIR | NAME | SHIFT | NEWSHIFT | S/N | NAME | SHIFT | NEWSHIFT | S/N |
| 0 | 15290053 | 0.504524 | 0.00000 | 18.9643 | 15290055 | 0.000219186 | 0.504305 | 18.9605 |
| 1 | 15290057 | 0.503846 | 0.000678003 | 19.0696 | 15290058 | 0.000897920 | 0.503626 | 18.9612 |
| 2 | 15290056 | 0.503633 | 0.000890970 | 18.9615 | 15290054 | 2.40618e-05 | 0.504500 | 18.8728 |
| 3 | 15290060 | 0.503559 | 0.000964999 | 18.9426 | 15290051 | 0.00000 | 0.504524 | 18.8369 |
| 4 | 15290052 | 0.503661 | 0.000863016 | 18.9281 | 15290059 | 0.000440042 | 0.504084 | 18.8361 |