| Red | Green | Blue | |
| z | 17.64 | ||
| znorm | Inf | ||
| sky | -Inf | -Inf | -Inf |
| S/N | 17.8 | 32.7 | 36.1 |
| S/N(c) | 0.0 | 0.0 | 0.0 |
| SN(E/C) |
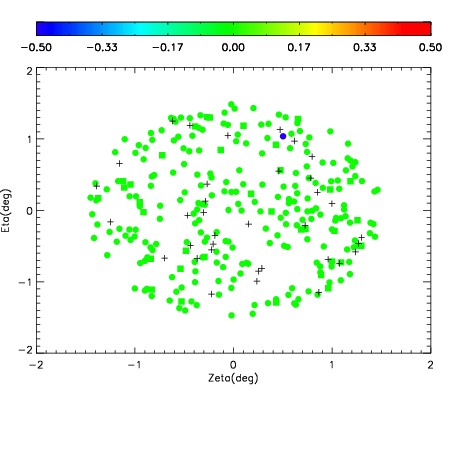
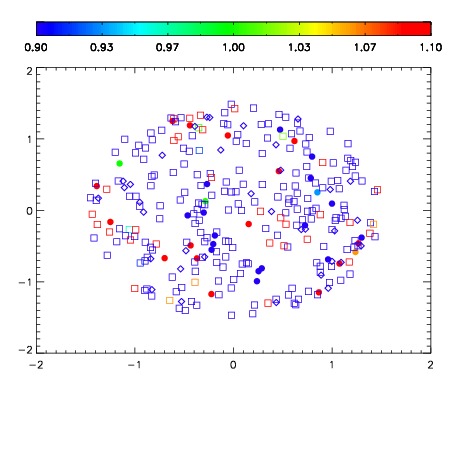


| Frame | Nreads | Zeropoints | Mag plots | Spatial mag deviation | Spatial sky 16325A emission deviations (filled: sky, open: star) | Spatial sky continuum emission | Spatial sky telluric CO2 absorption deviations (filled: H < 10) | |||||||||||||||||||||||
| 0 | 0 |
|
|
|
|
|
|
| IPAIR | NAME | SHIFT | NEWSHIFT | S/N | NAME | SHIFT | NEWSHIFT | S/N |
| 0 | 16050042 | 0.00167586 | 0.00000 | 18.2106 | 16050041 | -0.486984 | 0.488660 | 18.2186 |
| 1 | 16050035 | 0.00000 | 0.00167586 | 18.3751 | 16050036 | -0.487798 | 0.489474 | 18.4583 |
| 2 | 16050038 | 0.000558324 | 0.00111754 | 18.2852 | 16050037 | -0.488717 | 0.490393 | 18.3841 |
| 3 | 16050039 | 0.00117454 | 0.000501320 | 17.5775 | 16050040 | -0.486787 | 0.488463 | 17.6343 |