| Red | Green | Blue | |
| z | 17.64 | ||
| znorm | Inf | ||
| sky | -Inf | -NaN | -Inf |
| S/N | 25.3 | 43.9 | 50.0 |
| S/N(c) | 0.0 | 0.0 | 0.0 |
| SN(E/C) |


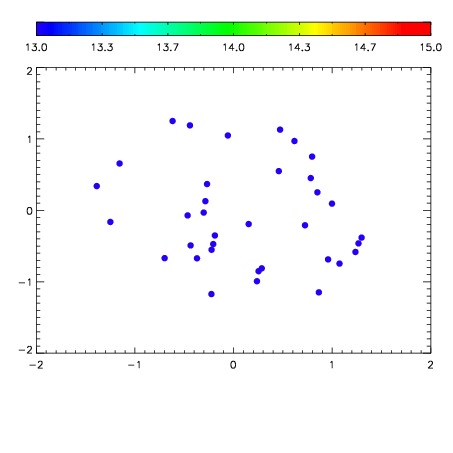

| Frame | Nreads | Zeropoints | Mag plots | Spatial mag deviation | Spatial sky 16325A emission deviations (filled: sky, open: star) | Spatial sky continuum emission | Spatial sky telluric CO2 absorption deviations (filled: H < 10) | |||||||||||||||||||||||
| 0 | 0 |
|
|
|
|
|
|
| IPAIR | NAME | SHIFT | NEWSHIFT | S/N | NAME | SHIFT | NEWSHIFT | S/N |
| 0 | 16070065 | 0.490378 | 0.00000 | 18.4681 | 16070055 | 0.00000 | 0.490378 | 18.4304 |
| 1 | 16070060 | 0.486322 | 0.00405601 | 18.6072 | 16070059 | -0.000343474 | 0.490721 | 18.5881 |
| 2 | 16070061 | 0.487546 | 0.00283200 | 18.5704 | 16070062 | 0.000693574 | 0.489684 | 18.4838 |
| 3 | 16070056 | 0.487294 | 0.00308400 | 18.4336 | 16070066 | 0.00230821 | 0.488070 | 18.4266 |
| 4 | 16070057 | 0.485884 | 0.00449398 | 18.2783 | 16070058 | 2.99935e-05 | 0.490348 | 18.1960 |
| 5 | 16070064 | 0.489241 | 0.00113699 | 18.0093 | 16070063 | 0.00194648 | 0.488432 | 18.0522 |