| Red | Green | Blue | |
| z | 17.64 | ||
| znorm | Inf | ||
| sky | -Inf | -Inf | -NaN |
| S/N | 22.8 | 38.1 | 44.9 |
| S/N(c) | 0.0 | 0.0 | 0.0 |
| SN(E/C) |
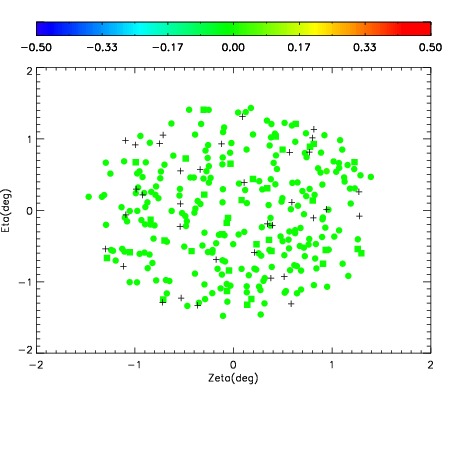

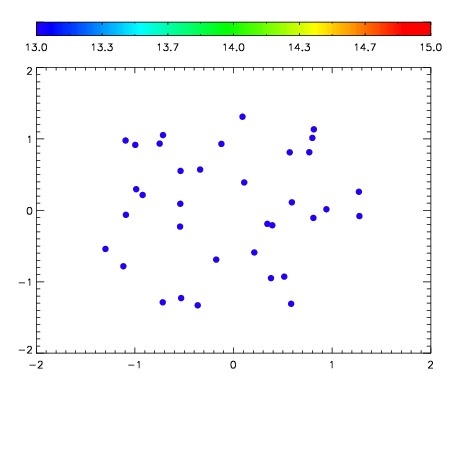

| Frame | Nreads | Zeropoints | Mag plots | Spatial mag deviation | Spatial sky 16325A emission deviations (filled: sky, open: star) | Spatial sky continuum emission | Spatial sky telluric CO2 absorption deviations (filled: H < 10) | |||||||||||||||||||||||
| 0 | 0 |
|
|
|
|
|
|
| IPAIR | NAME | SHIFT | NEWSHIFT | S/N | NAME | SHIFT | NEWSHIFT | S/N |
| 0 | 20130015 | 0.498479 | 0.00000 | 18.0413 | 20130014 | -0.00451722 | 0.502996 | 17.9470 |
| 1 | 20130011 | 0.495225 | 0.00325400 | 19.0437 | 20130010 | 0.00000 | 0.498479 | 19.0318 |
| 2 | 20130016 | 0.497989 | 0.000490010 | 18.7760 | 20130017 | -0.00484474 | 0.503324 | 18.6925 |
| 3 | 20130012 | 0.495716 | 0.00276300 | 18.2163 | 20130013 | -0.00522987 | 0.503709 | 18.1267 |