| Frame | Nreads | Zeropoints | Mag plots
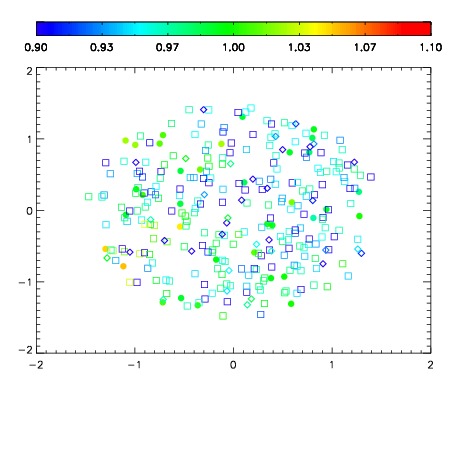
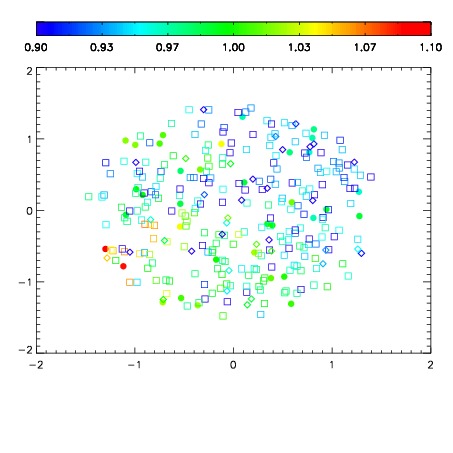
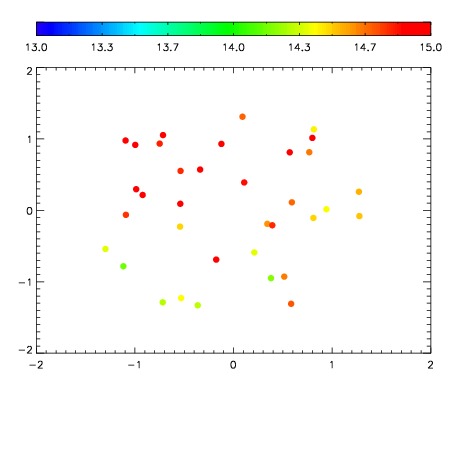
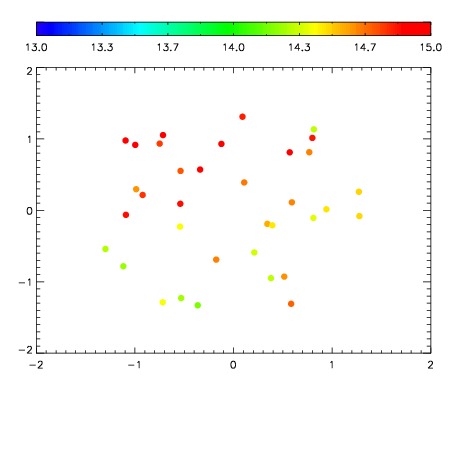
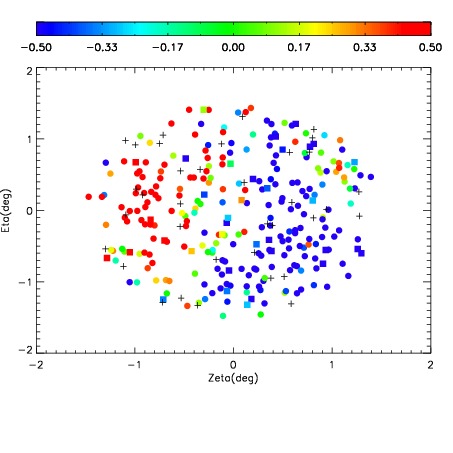
| Spatial mag deviation
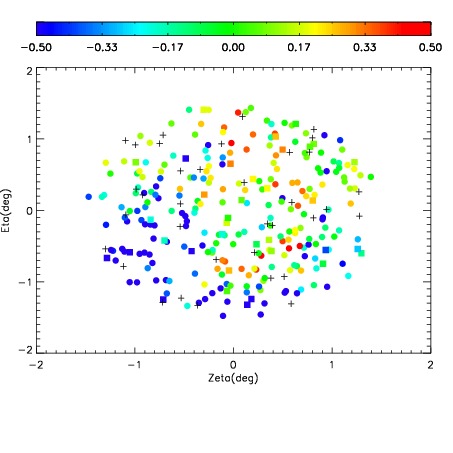
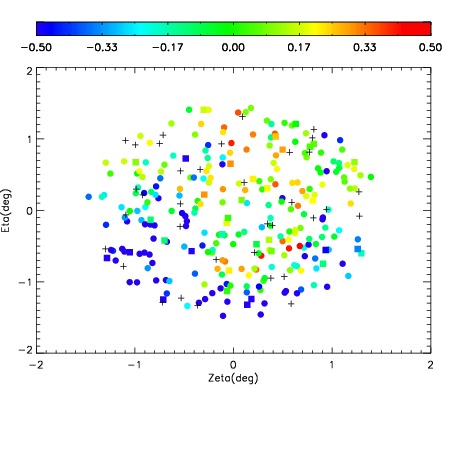
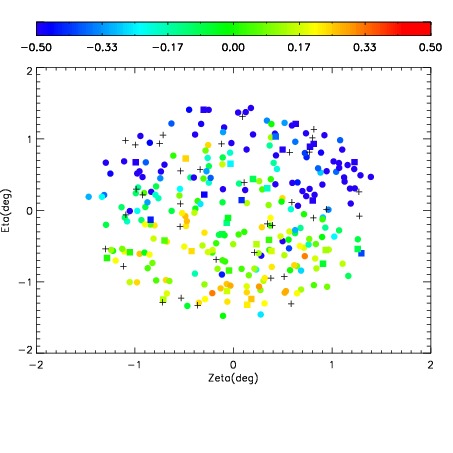
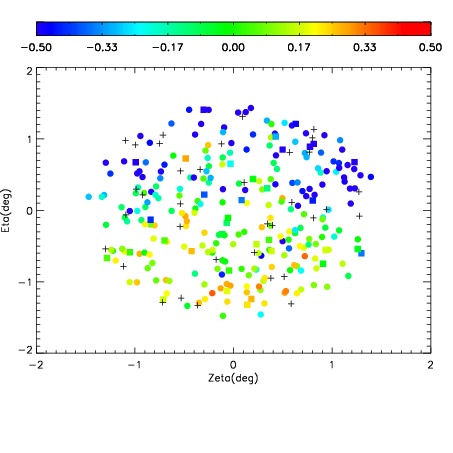
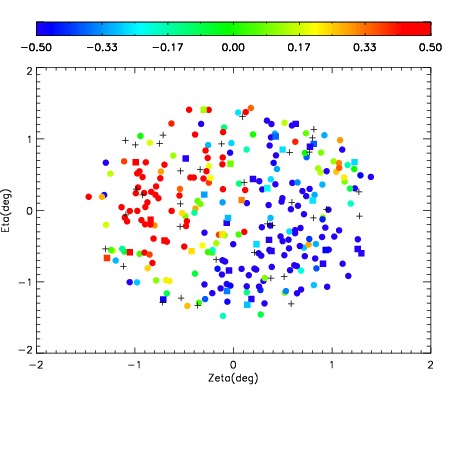
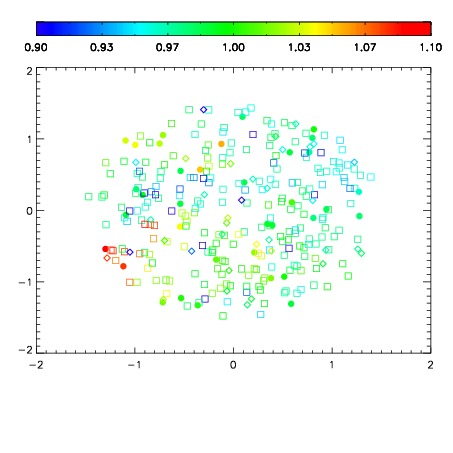
| Spatial sky 16325A emission deviations (filled: sky, open: star)
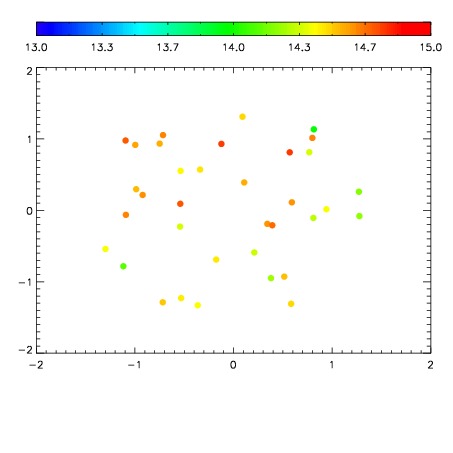
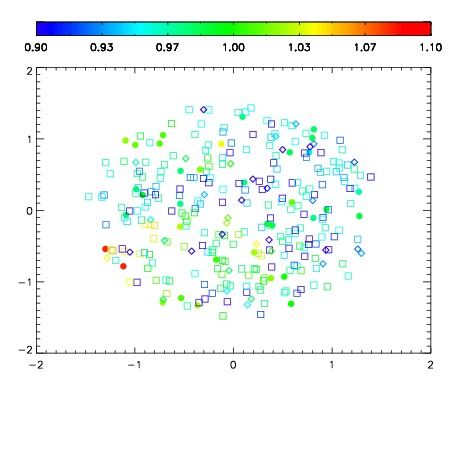
| Spatial sky continuum emission
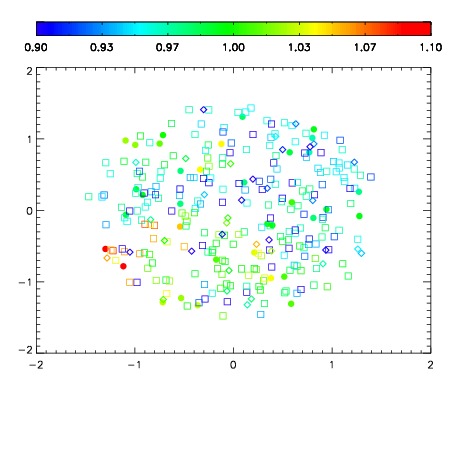
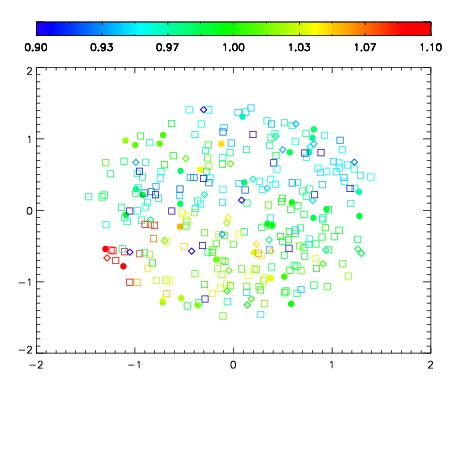
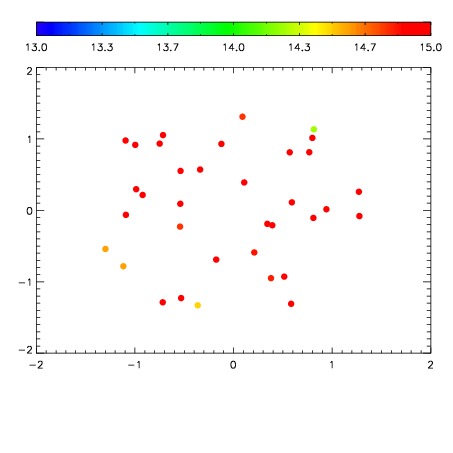
| Spatial sky telluric CO2 absorption deviations (filled: H < 10)
|
| 20140028
| 42
| | Red | Green | Blue
| | z | | 18.63
| | znorm | | 14.58
| | sky | 14.3 | 14.5 | 14.8
| | S/N | 12.8 | 21.0 | 24.7
| | S/N(c) | 10.0 | 14.5 | 5.6
| | SN(E/C) 0.63
|
| 
| 
| 
| 
| 
|
| 20140029
| 42
| | Red | Green | Blue
| | z | | 18.68
| | znorm | | 14.62
| | sky | 14.6 | 14.7 | 14.9
| | S/N | 13.2 | 21.5 | 25.2
| | S/N(c) | 10.1 | 14.7 | 5.9
| | SN(E/C) 0.63
|
| 
| 
| 
| 
| 
|
| 20140030
| 42
| | Red | Green | Blue
| | z | | 18.77
| | znorm | | 14.71
| | sky | 14.6 | 14.7 | 15.0
| | S/N | 12.1 | 20.9 | 23.9
| | S/N(c) | 10.1 | 14.6 | 5.9
| | SN(E/C) 0.66
|
| 
| 
| 
| 
| 
|
| 20140031
| 42
| | Red | Green | Blue
| | z | | 18.68
| | znorm | | 14.62
| | sky | 14.5 | 14.6 | 15.0
| | S/N | 11.6 | 20.0 | 22.9
| | S/N(c) | 9.9 | 14.4 | 5.7
| | SN(E/C) 0.68
|
| 
| 
| 
| 
| 
|
| 20140032
| 42
| | Red | Green | Blue
| | z | | 17.80
| | znorm | | 13.74
| | sky | 14.4 | 14.8 | 15.1
| | S/N | 6.1 | 12.2 | 13.2
| | S/N(c) | 5.6 | 9.1 | 3.6
| | SN(E/C) 0.82
|
| 
| 
| 
| 
| 
|
| 20140033
| 42
| | Red | Green | Blue
| | z | | 17.57
| | znorm | | 13.51
| | sky | 15.0 | 15.0 | 15.0
| | S/N | 5.1 | 10.4 | 11.6
| | S/N(c) | 4.7 | 7.8 | 3.1
| | SN(E/C) 0.89
|
| 
| 
| 
| 
| 
|