| Red | Green | Blue | |
| z | 17.64 | ||
| znorm | Inf | ||
| sky | -Inf | -Inf | -NaN |
| S/N | 17.6 | 30.2 | 34.8 |
| S/N(c) | 0.0 | 0.0 | 0.0 |
| SN(E/C) |
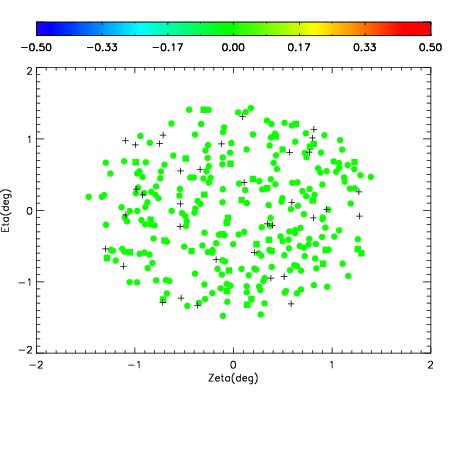
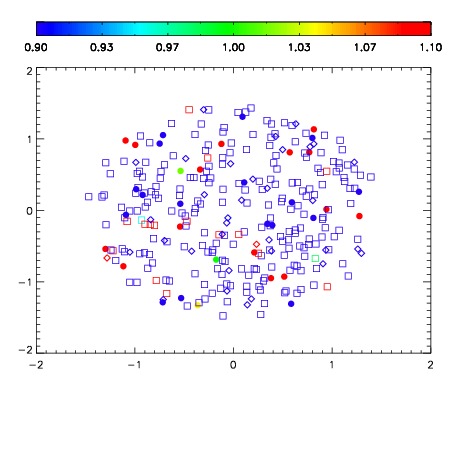


| Frame | Nreads | Zeropoints | Mag plots | Spatial mag deviation | Spatial sky 16325A emission deviations (filled: sky, open: star) | Spatial sky continuum emission | Spatial sky telluric CO2 absorption deviations (filled: H < 10) | |||||||||||||||||||||||
| 0 | 0 |
|
|
|
|
|
|
| IPAIR | NAME | SHIFT | NEWSHIFT | S/N | NAME | SHIFT | NEWSHIFT | S/N |
| 0 | 20140033 | 0.506581 | 0.00000 | 17.3044 | 20140032 | 0.0100041 | 0.496577 | 17.6016 |
| 1 | 20140030 | 0.504446 | 0.00213498 | 18.6996 | 20140031 | 0.00967486 | 0.496906 | 18.6234 |
| 2 | 20140029 | 0.501725 | 0.00485599 | 18.6352 | 20140028 | 0.00000 | 0.506581 | 18.5874 |