| Red | Green | Blue | |
| z | 17.64 | ||
| znorm | Inf | ||
| sky | -Inf | -Inf | -NaN |
| S/N | 23.6 | 40.0 | 46.7 |
| S/N(c) | 0.0 | 0.0 | 0.0 |
| SN(E/C) |


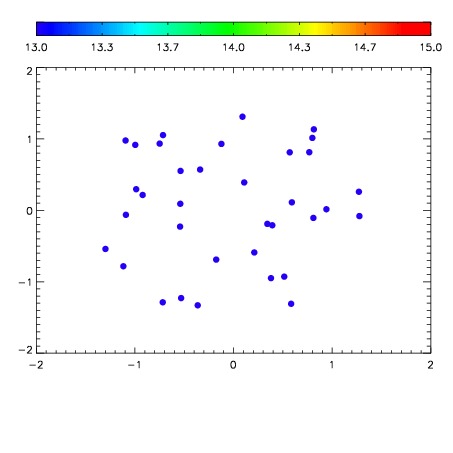

| Frame | Nreads | Zeropoints | Mag plots | Spatial mag deviation | Spatial sky 16325A emission deviations (filled: sky, open: star) | Spatial sky continuum emission | Spatial sky telluric CO2 absorption deviations (filled: H < 10) | |||||||||||||||||||||||
| 0 | 0 |
|
|
|
|
|
|
| IPAIR | NAME | SHIFT | NEWSHIFT | S/N | NAME | SHIFT | NEWSHIFT | S/N |
| 0 | 20160020 | 0.499596 | 0.00000 | 15.9838 | 20160019 | 0.00222741 | 0.497369 | 17.2107 |
| 1 | 20160013 | 0.492625 | 0.00697100 | 18.9514 | 20160014 | -0.000147118 | 0.499743 | 18.9945 |
| 2 | 20160012 | 0.492139 | 0.00745699 | 18.9117 | 20160011 | 0.00000 | 0.499596 | 18.9160 |
| 3 | 20160017 | 0.497009 | 0.00258699 | 18.5926 | 20160018 | 0.000976004 | 0.498620 | 18.6148 |
| 4 | 20160016 | 0.498972 | 0.000624001 | 17.7865 | 20160015 | 0.00163986 | 0.497956 | 18.0077 |