| Red | Green | Blue | |
| z | 17.64 | ||
| znorm | Inf | ||
| sky | -Inf | -Inf | -NaN |
| S/N | 18.9 | 32.3 | 37.9 |
| S/N(c) | 0.0 | 0.0 | 0.0 |
| SN(E/C) |
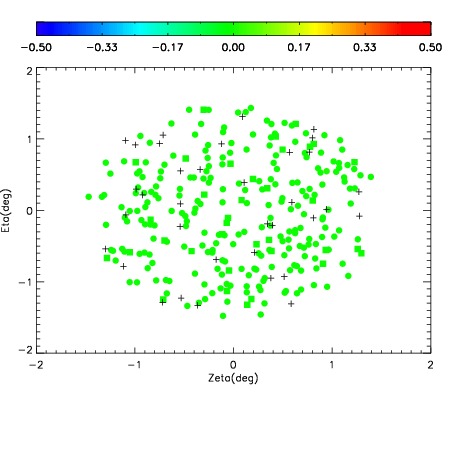
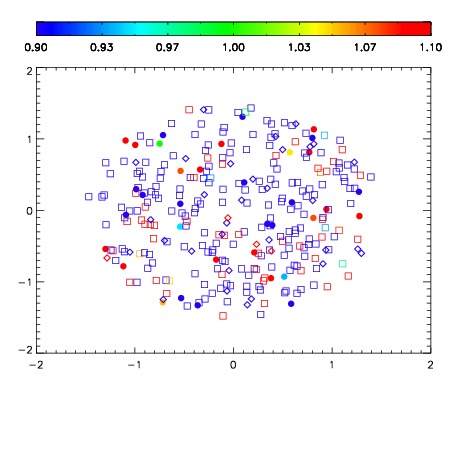


| Frame | Nreads | Zeropoints | Mag plots | Spatial mag deviation | Spatial sky 16325A emission deviations (filled: sky, open: star) | Spatial sky continuum emission | Spatial sky telluric CO2 absorption deviations (filled: H < 10) | |||||||||||||||||||||||
| 0 | 0 |
|
|
|
|
|
|
| IPAIR | NAME | SHIFT | NEWSHIFT | S/N | NAME | SHIFT | NEWSHIFT | S/N |
| 0 | 20170016 | 0.497799 | 0.00000 | 18.1555 | 20170015 | -0.000996820 | 0.498796 | 18.1243 |
| 1 | 20170013 | 0.494831 | 0.00296801 | 18.6983 | 20170011 | 0.00000 | 0.497799 | 18.7422 |
| 2 | 20170012 | 0.494027 | 0.00377202 | 18.6522 | 20170014 | -0.000917996 | 0.498717 | 18.7115 |