| Red | Green | Blue | |
| z | 17.64 | ||
| znorm | Inf | ||
| sky | -NaN | -Inf | -NaN |
| S/N | 25.4 | 40.6 | 47.4 |
| S/N(c) | 0.0 | 0.0 | 0.0 |
| SN(E/C) |
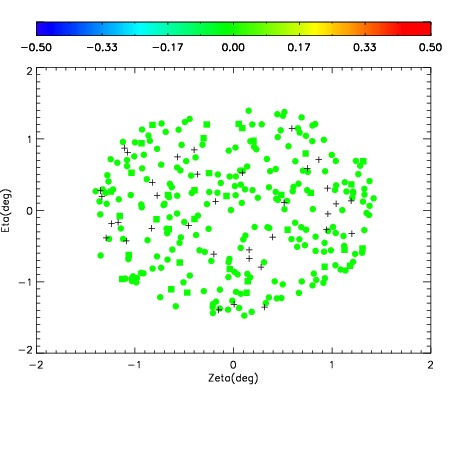


| Frame | Nreads | Zeropoints | Mag plots | Spatial mag deviation | Spatial sky 16325A emission deviations (filled: sky, open: star) | Spatial sky continuum emission | Spatial sky telluric CO2 absorption deviations (filled: H < 10) | |||||||||||||||||||||||
| 0 | 0 |
|
|
|
|
|
|
| IPAIR | NAME | SHIFT | NEWSHIFT | S/N | NAME | SHIFT | NEWSHIFT | S/N |
| 0 | 17180018 | 0.488784 | 0.00000 | 17.6219 | 17180019 | 0.0139599 | 0.474824 | 17.5216 |
| 1 | 17180013 | 0.481447 | 0.00733697 | 19.2163 | 17180012 | 0.00000 | 0.488784 | 19.2063 |
| 2 | 17180014 | 0.483925 | 0.00485897 | 18.7593 | 17180015 | 0.00416381 | 0.484620 | 18.7795 |
| 3 | 17180017 | 0.486611 | 0.00217298 | 18.6098 | 17180016 | 0.00570661 | 0.483077 | 18.6268 |