| Red | Green | Blue | |
| z | 17.64 | ||
| znorm | Inf | ||
| sky | -Inf | -Inf | -NaN |
| S/N | 24.2 | 39.7 | 46.0 |
| S/N(c) | 0.0 | 0.0 | 0.0 |
| SN(E/C) |

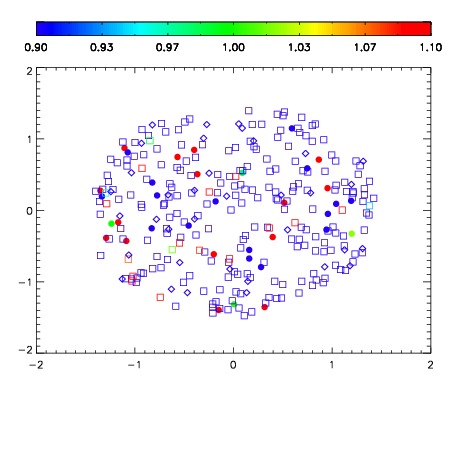


| Frame | Nreads | Zeropoints | Mag plots | Spatial mag deviation | Spatial sky 16325A emission deviations (filled: sky, open: star) | Spatial sky continuum emission | Spatial sky telluric CO2 absorption deviations (filled: H < 10) | |||||||||||||||||||||||
| 0 | 0 |
|
|
|
|
|
|
| IPAIR | NAME | SHIFT | NEWSHIFT | S/N | NAME | SHIFT | NEWSHIFT | S/N |
| 0 | 17210017 | 0.486449 | 0.00000 | 17.4697 | 17210018 | 0.00360731 | 0.482842 | 17.2512 |
| 1 | 17210012 | 0.483940 | 0.00250900 | 19.1968 | 17210011 | 0.00000 | 0.486449 | 19.1603 |
| 2 | 17210013 | 0.483987 | 0.00246200 | 18.7007 | 17210014 | -0.00133831 | 0.487787 | 18.6669 |
| 3 | 17210016 | 0.484430 | 0.00201902 | 18.5648 | 17210015 | -0.000239039 | 0.486688 | 18.5795 |