| Red | Green | Blue | |
| z | 17.64 | ||
| znorm | Inf | ||
| sky | -Inf | -Inf | -Inf |
| S/N | 32.4 | 54.9 | 63.9 |
| S/N(c) | 0.0 | 0.0 | 0.0 |
| SN(E/C) |
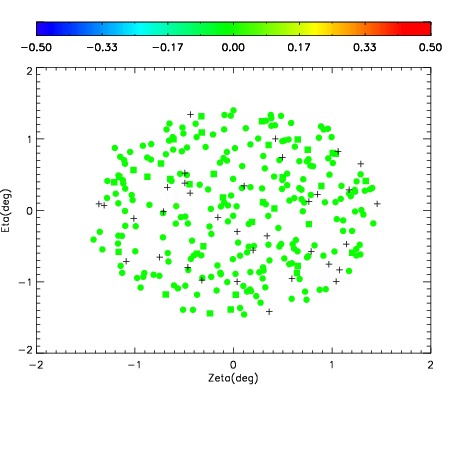


| Frame | Nreads | Zeropoints | Mag plots | Spatial mag deviation | Spatial sky 16325A emission deviations (filled: sky, open: star) | Spatial sky continuum emission | Spatial sky telluric CO2 absorption deviations (filled: H < 10) | |||||||||||||||||||||||
| 0 | 0 |
|
|
|
|
|
|
| IPAIR | NAME | SHIFT | NEWSHIFT | S/N | NAME | SHIFT | NEWSHIFT | S/N |
| 0 | 16040059 | 0.00428343 | 0.00000 | 18.1165 | 16040060 | -0.481993 | 0.486276 | 18.0101 |
| 1 | 16040047 | 0.00325625 | 0.00102718 | 18.7095 | 16040048 | -0.479082 | 0.483365 | 18.6026 |
| 2 | 16040058 | 0.00400089 | 0.000282540 | 18.5226 | 16040057 | -0.482458 | 0.486741 | 18.5053 |
| 3 | 16040055 | 0.00366310 | 0.000620330 | 18.4626 | 16040061 | -0.482294 | 0.486577 | 18.4967 |
| 4 | 16040051 | 0.00237582 | 0.00190761 | 18.4468 | 16040044 | -0.479292 | 0.483575 | 18.4777 |
| 5 | 16040062 | 0.00291996 | 0.00136347 | 18.4186 | 16040052 | -0.479832 | 0.484115 | 18.4750 |
| 6 | 16040046 | 0.00248738 | 0.00179605 | 18.3951 | 16040053 | -0.478933 | 0.483216 | 18.4119 |
| 7 | 16040050 | 0.00188795 | 0.00239548 | 18.3458 | 16040056 | -0.480675 | 0.484958 | 18.4081 |
| 8 | 16040054 | 0.00347262 | 0.000810810 | 18.3382 | 16040045 | -0.479456 | 0.483739 | 18.3330 |
| 9 | 16040043 | 0.00000 | 0.00428343 | 18.3360 | 16040049 | -0.479727 | 0.484010 | 18.3040 |