| Red | Green | Blue | |
| z | 17.64 | ||
| znorm | Inf | ||
| sky | -Inf | -Inf | -Inf |
| S/N | 17.5 | 30.5 | 35.2 |
| S/N(c) | 0.0 | 0.0 | 0.0 |
| SN(E/C) |


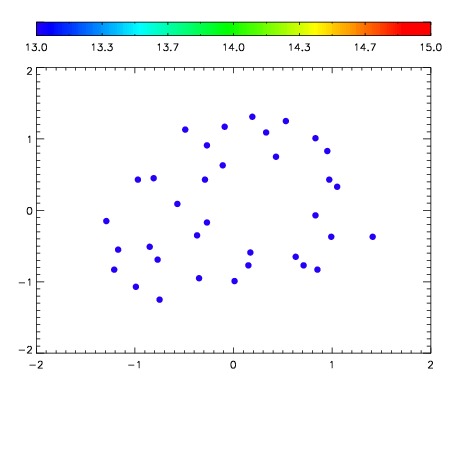

| Frame | Nreads | Zeropoints | Mag plots | Spatial mag deviation | Spatial sky 16325A emission deviations (filled: sky, open: star) | Spatial sky continuum emission | Spatial sky telluric CO2 absorption deviations (filled: H < 10) | |||||||||||||||||||||||
| 0 | 0 |
|
|
|
|
|
|
| IPAIR | NAME | SHIFT | NEWSHIFT | S/N | NAME | SHIFT | NEWSHIFT | S/N |
| 0 | 20140040 | 0.000515622 | 0.00000 | 18.3667 | 20140039 | -0.496700 | 0.497216 | 18.3988 |
| 1 | 20140041 | -0.000463922 | 0.000979544 | 18.4911 | 20140042 | -0.497143 | 0.497659 | 18.4820 |
| 2 | 20140037 | 0.00000 | 0.000515622 | 18.1984 | 20140038 | -0.495799 | 0.496315 | 18.2764 |