| Red | Green | Blue | |
| z | 17.64 | ||
| znorm | Inf | ||
| sky | -Inf | -Inf | -Inf |
| S/N | 16.5 | 29.1 | 33.5 |
| S/N(c) | 0.0 | 0.0 | 0.0 |
| SN(E/C) |
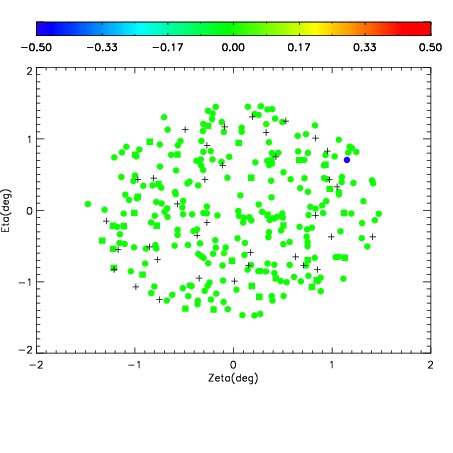
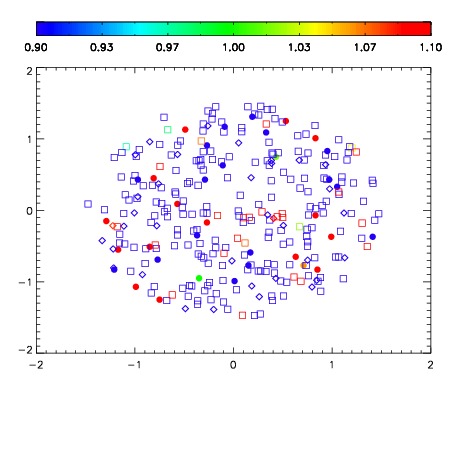


| Frame | Nreads | Zeropoints | Mag plots | Spatial mag deviation | Spatial sky 16325A emission deviations (filled: sky, open: star) | Spatial sky continuum emission | Spatial sky telluric CO2 absorption deviations (filled: H < 10) | |||||||||||||||||||||||
| 0 | 0 |
|
|
|
|
|
|
| IPAIR | NAME | SHIFT | NEWSHIFT | S/N | NAME | SHIFT | NEWSHIFT | S/N |
| 0 | 20170044 | 0.491918 | 0.00000 | 18.0549 | 20170045 | 0.000652732 | 0.491265 | 18.0338 |
| 1 | 20170047 | 0.487983 | 0.00393501 | 18.7037 | 20170046 | -0.00100053 | 0.492919 | 18.7595 |
| 2 | 20170043 | 0.490528 | 0.00139001 | 17.8248 | 20170042 | 0.00000 | 0.491918 | 17.7949 |