| Red | Green | Blue | |
| z | 17.64 | ||
| znorm | Inf | ||
| sky | -Inf | -Inf | -NaN |
| S/N | 23.8 | 42.6 | 48.5 |
| S/N(c) | 0.0 | 0.0 | 0.0 |
| SN(E/C) |


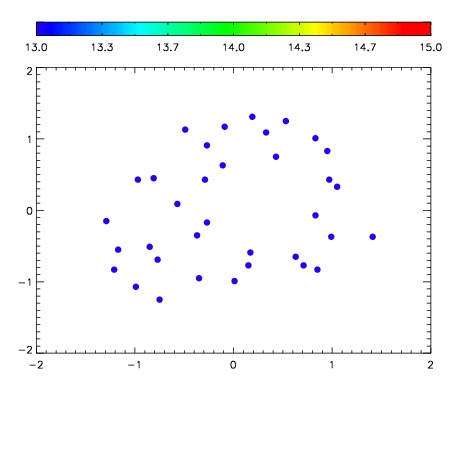

| Frame | Nreads | Zeropoints | Mag plots | Spatial mag deviation | Spatial sky 16325A emission deviations (filled: sky, open: star) | Spatial sky continuum emission | Spatial sky telluric CO2 absorption deviations (filled: H < 10) | |||||||||||||||||||||||
| 0 | 0 |
|
|
|
|
|
|
| IPAIR | NAME | SHIFT | NEWSHIFT | S/N | NAME | SHIFT | NEWSHIFT | S/N |
| 0 | 20180052 | 0.00457628 | 0.00000 | 18.4929 | 20180051 | -0.498113 | 0.502689 | 18.5150 |
| 1 | 20180045 | 0.00121044 | 0.00336584 | 18.7389 | 20180046 | -0.494601 | 0.499177 | 18.7278 |
| 2 | 20180049 | -0.000753623 | 0.00532990 | 18.3583 | 20180050 | -0.497074 | 0.501650 | 18.3669 |
| 3 | 20180048 | -0.00211527 | 0.00669155 | 18.2188 | 20180047 | -0.496021 | 0.500597 | 18.1664 |
| 4 | 20180044 | 0.00290797 | 0.00166831 | 18.1033 | 20180043 | -0.495597 | 0.500173 | 18.0814 |
| 5 | 20180041 | 0.00000 | 0.00457628 | 17.6529 | 20180042 | -0.496779 | 0.501355 | 17.7546 |