| Red | Green | Blue | |
| z | 17.64 | ||
| znorm | Inf | ||
| sky | -Inf | -Inf | -Inf |
| S/N | 23.5 | 42.6 | 48.2 |
| S/N(c) | 0.0 | 0.0 | 0.0 |
| SN(E/C) |
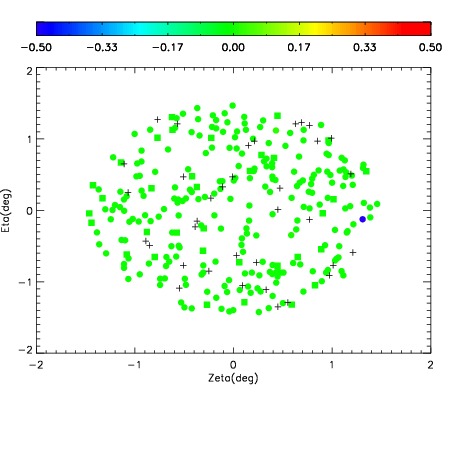
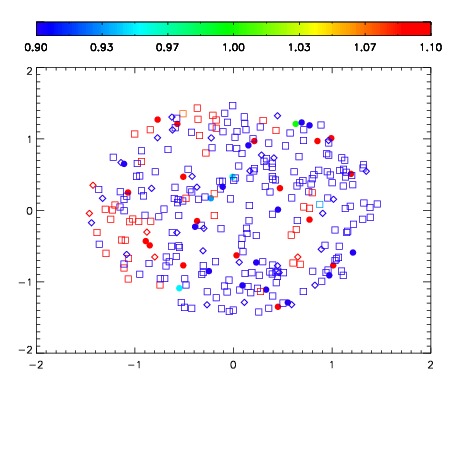


| Frame | Nreads | Zeropoints | Mag plots | Spatial mag deviation | Spatial sky 16325A emission deviations (filled: sky, open: star) | Spatial sky continuum emission | Spatial sky telluric CO2 absorption deviations (filled: H < 10) | |||||||||||||||||||||||
| 0 | 0 |
|
|
|
|
|
|
| IPAIR | NAME | SHIFT | NEWSHIFT | S/N | NAME | SHIFT | NEWSHIFT | S/N |
| 0 | 19920064 | 0.496937 | 0.00000 | 18.1437 | 19920065 | -0.00214313 | 0.499080 | 18.1553 |
| 1 | 19920063 | 0.494613 | 0.00232401 | 18.4909 | 19920062 | -0.00832990 | 0.505267 | 18.5858 |
| 2 | 19920068 | 0.494805 | 0.00213200 | 18.3458 | 19920069 | -0.00286202 | 0.499799 | 18.3509 |
| 3 | 19920059 | 0.495178 | 0.00175899 | 18.0849 | 19920058 | 0.00000 | 0.496937 | 18.1398 |
| 4 | 19920067 | 0.494178 | 0.00275901 | 18.0332 | 19920061 | -0.00725024 | 0.504187 | 18.0065 |
| 5 | 19920060 | 0.495431 | 0.00150600 | 17.9806 | 19920066 | -0.00119678 | 0.498134 | 17.9793 |