| Red | Green | Blue | |
| z | 17.64 | ||
| znorm | Inf | ||
| sky | -Inf | -Inf | -Inf |
| S/N | 16.6 | 28.1 | 32.2 |
| S/N(c) | 0.0 | 0.0 | 0.0 |
| SN(E/C) |


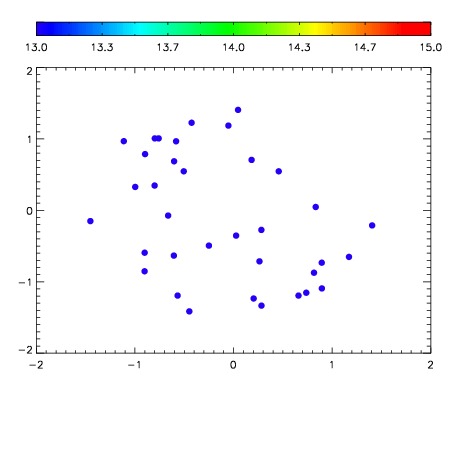

| Frame | Nreads | Zeropoints | Mag plots | Spatial mag deviation | Spatial sky 16325A emission deviations (filled: sky, open: star) | Spatial sky continuum emission | Spatial sky telluric CO2 absorption deviations (filled: H < 10) | |||||||||||||||||||||||
| 0 | 0 |
|
|
|
|
|
|
| IPAIR | NAME | SHIFT | NEWSHIFT | S/N | NAME | SHIFT | NEWSHIFT | S/N |
| 0 | 19910053 | 0.505617 | 0.00000 | 17.8420 | 19910054 | 0.00753433 | 0.498083 | 17.9019 |
| 1 | 19910056 | 0.501086 | 0.00453103 | 18.8345 | 19910055 | 0.00584038 | 0.499777 | 18.7251 |
| 2 | 19910052 | 0.503564 | 0.00205302 | 17.7352 | 19910051 | 0.00000 | 0.505617 | 17.7464 |