| Red | Green | Blue | |
| z | 17.64 | ||
| znorm | Inf | ||
| sky | -Inf | -Inf | -Inf |
| S/N | 10.8 | 20.1 | 22.8 |
| S/N(c) | 0.0 | 0.0 | 0.0 |
| SN(E/C) |
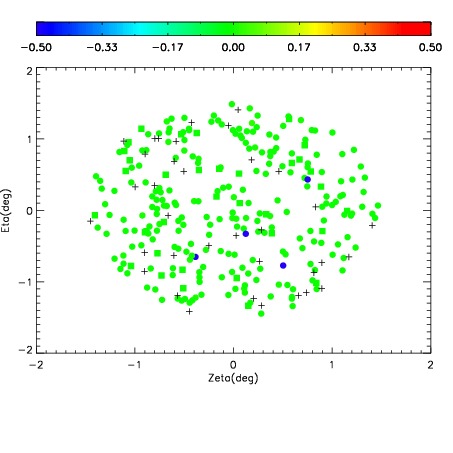


| Frame | Nreads | Zeropoints | Mag plots | Spatial mag deviation | Spatial sky 16325A emission deviations (filled: sky, open: star) | Spatial sky continuum emission | Spatial sky telluric CO2 absorption deviations (filled: H < 10) | |||||||||||||||||||||||
| 0 | 0 |
|
|
|
|
|
|
| IPAIR | NAME | SHIFT | NEWSHIFT | S/N | NAME | SHIFT | NEWSHIFT | S/N |
| 0 | 20080031 | 0.501270 | 0.00000 | 17.6450 | 20080026 | 0.00000 | 0.501270 | 17.4522 |
| 1 | 20080028 | 0.500051 | 0.00121897 | 17.7529 | 20080030 | -0.00214121 | 0.503411 | 17.9560 |
| 2 | 20080027 | 0.499035 | 0.00223500 | 17.6950 | 20080029 | -0.00156250 | 0.502832 | 17.4924 |