| Red | Green | Blue | |
| z | 17.64 | ||
| znorm | Inf | ||
| sky | -Inf | -Inf | -Inf |
| S/N | 21.6 | 35.0 | 41.5 |
| S/N(c) | 0.0 | 0.0 | 0.0 |
| SN(E/C) |
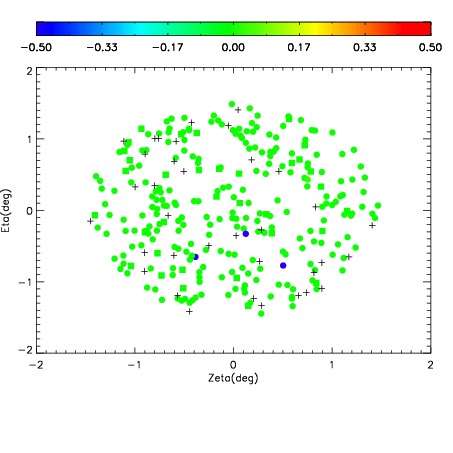
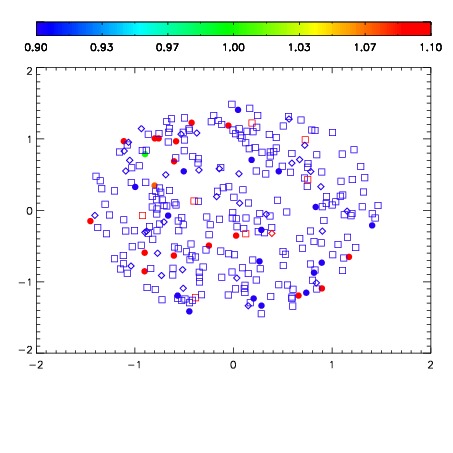


| Frame | Nreads | Zeropoints | Mag plots | Spatial mag deviation | Spatial sky 16325A emission deviations (filled: sky, open: star) | Spatial sky continuum emission | Spatial sky telluric CO2 absorption deviations (filled: H < 10) | |||||||||||||||||||||||
| 0 | 0 |
|
|
|
|
|
|
| IPAIR | NAME | SHIFT | NEWSHIFT | S/N | NAME | SHIFT | NEWSHIFT | S/N |
| 0 | 20100031 | 0.510589 | 0.00000 | 18.0266 | 20100032 | 0.00159422 | 0.508995 | 18.0445 |
| 1 | 20100034 | 0.500100 | 0.0104890 | 18.6980 | 20100033 | -0.000818411 | 0.511407 | 18.7185 |
| 2 | 20100035 | 0.501094 | 0.00949502 | 18.6800 | 20100036 | 0.00134659 | 0.509242 | 18.5766 |
| 3 | 20100030 | 0.508226 | 0.00236303 | 17.8789 | 20100029 | 0.00000 | 0.510589 | 17.8576 |