| Red | Green | Blue | |
| z | 17.64 | ||
| znorm | Inf | ||
| sky | -Inf | -Inf | -Inf |
| S/N | 16.8 | 27.8 | 32.8 |
| S/N(c) | 0.0 | 0.0 | 0.0 |
| SN(E/C) |

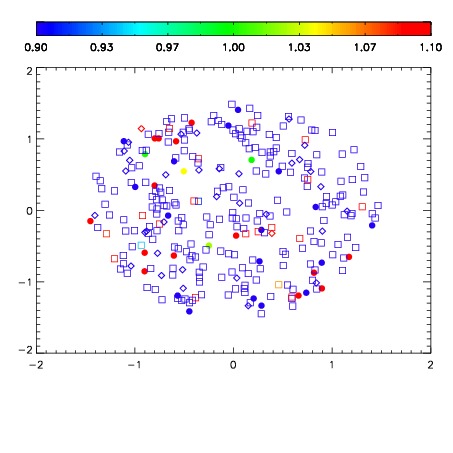


| Frame | Nreads | Zeropoints | Mag plots | Spatial mag deviation | Spatial sky 16325A emission deviations (filled: sky, open: star) | Spatial sky continuum emission | Spatial sky telluric CO2 absorption deviations (filled: H < 10) | |||||||||||||||||||||||
| 0 | 0 |
|
|
|
|
|
|
| IPAIR | NAME | SHIFT | NEWSHIFT | S/N | NAME | SHIFT | NEWSHIFT | S/N |
| 0 | 20110044 | 0.00000 | 0.00000 | 17.9013 | 20110045 | -0.503469 | 0.503469 | 17.8674 |
| 1 | 20110048 | -0.00524405 | 0.00524405 | 18.7377 | 20110049 | -0.506322 | 0.506322 | 18.6716 |
| 2 | 20110047 | -0.00379126 | 0.00379126 | 18.0527 | 20110046 | -0.504766 | 0.504766 | 17.9518 |