| Red | Green | Blue | |
| z | 17.64 | ||
| znorm | Inf | ||
| sky | -Inf | -Inf | -NaN |
| S/N | 30.8 | 54.7 | 59.7 |
| S/N(c) | 0.0 | 0.0 | 0.0 |
| SN(E/C) |
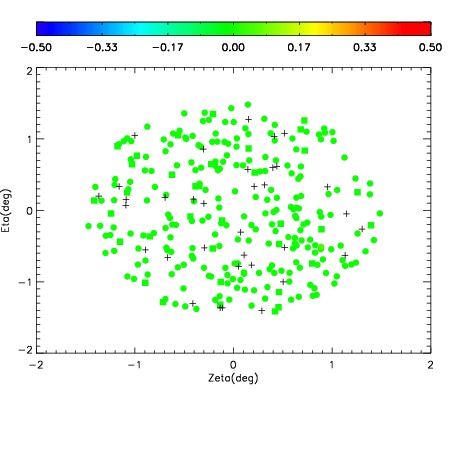
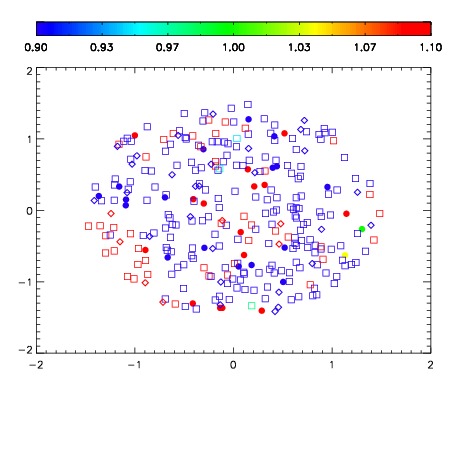
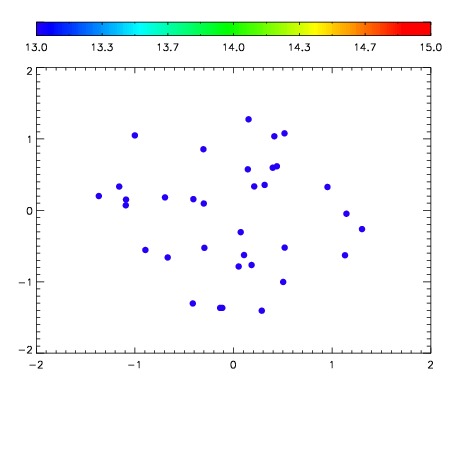

| Frame | Nreads | Zeropoints | Mag plots | Spatial mag deviation | Spatial sky 16325A emission deviations (filled: sky, open: star) | Spatial sky continuum emission | Spatial sky telluric CO2 absorption deviations (filled: H < 10) | |||||||||||||||||||||||
| 0 | 0 |
|
|
|
|
|
|
| IPAIR | NAME | SHIFT | NEWSHIFT | S/N | NAME | SHIFT | NEWSHIFT | S/N |
| 0 | 16060053 | 0.00162422 | 0.00000 | 18.2273 | 16060054 | -0.484068 | 0.485692 | 18.1685 |
| 1 | 16060057 | 0.00117181 | 0.000452410 | 18.6240 | 16060058 | -0.485009 | 0.486633 | 18.6244 |
| 2 | 16060056 | -0.000378767 | 0.00200299 | 18.4645 | 16060055 | -0.485605 | 0.487229 | 18.5076 |
| 3 | 16060052 | 0.00107913 | 0.000545090 | 18.4296 | 16060063 | -0.485470 | 0.487094 | 18.4674 |
| 4 | 16060061 | 0.00112378 | 0.000500440 | 18.4270 | 16060051 | -0.483907 | 0.485531 | 18.4389 |
| 5 | 16060064 | 0.00139446 | 0.000229760 | 18.4025 | 16060062 | -0.486063 | 0.487687 | 18.4129 |
| 6 | 16060049 | 0.00000 | 0.00162422 | 18.3474 | 16060050 | -0.484513 | 0.486137 | 18.4064 |
| 7 | 16060060 | 0.00128601 | 0.000338210 | 17.8945 | 16060059 | -0.485421 | 0.487045 | 17.9751 |
| 8 | 16060065 | 0.00148240 | 0.000141820 | 17.6603 | 16060066 | -0.485491 | 0.487115 | 17.5726 |