| Red | Green | Blue | |
| z | 17.64 | ||
| znorm | Inf | ||
| sky | -Inf | -Inf | -NaN |
| S/N | 24.9 | 44.2 | 47.5 |
| S/N(c) | 0.0 | 0.0 | 0.0 |
| SN(E/C) |
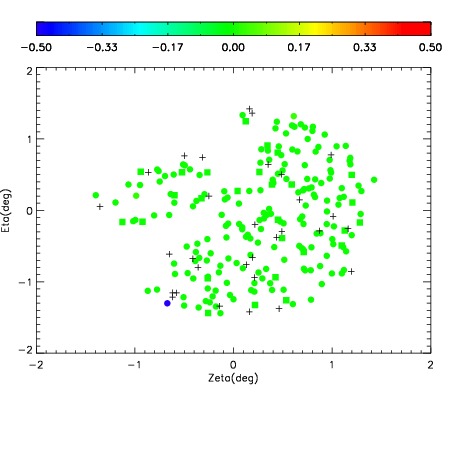

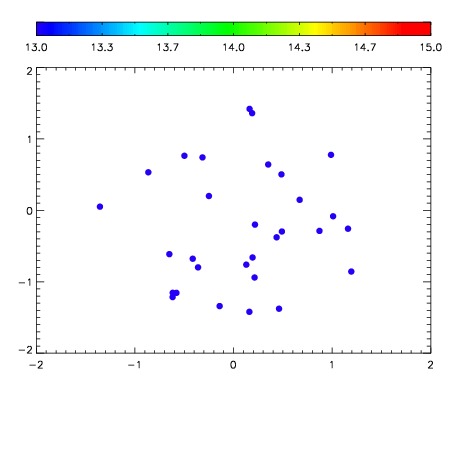

| Frame | Nreads | Zeropoints | Mag plots | Spatial mag deviation | Spatial sky 16325A emission deviations (filled: sky, open: star) | Spatial sky continuum emission | Spatial sky telluric CO2 absorption deviations (filled: H < 10) | |||||||||||||||||||||||
| 0 | 0 |
|
|
|
|
|
|
| IPAIR | NAME | SHIFT | NEWSHIFT | S/N | NAME | SHIFT | NEWSHIFT | S/N |
| 0 | 16250017 | 0.488586 | 0.00000 | 18.4467 | 16250019 | 0.000660550 | 0.487925 | 18.4278 |
| 1 | 16250012 | 0.485312 | 0.00327399 | 18.4672 | 16250018 | 0.000279931 | 0.488306 | 18.5126 |
| 2 | 16250013 | 0.487388 | 0.00119799 | 18.3126 | 16250011 | 0.00000 | 0.488586 | 18.4027 |
| 3 | 16250016 | 0.486553 | 0.00203300 | 18.2826 | 16250014 | 0.000254640 | 0.488331 | 18.3819 |
| 4 | 16250020 | 0.488342 | 0.000244021 | 18.2802 | 16250015 | -0.000316646 | 0.488903 | 18.3133 |
| 5 | 16250021 | 0.487404 | 0.00118202 | 18.1430 | 16250022 | -0.00111608 | 0.489702 | 18.1186 |