| Red | Green | Blue | |
| z | 17.64 | ||
| znorm | Inf | ||
| sky | -Inf | -Inf | -Inf |
| S/N | 28.0 | 49.5 | 56.2 |
| S/N(c) | 0.0 | 0.0 | 0.0 |
| SN(E/C) |
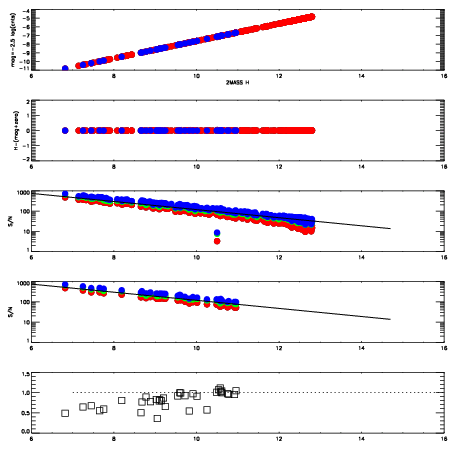
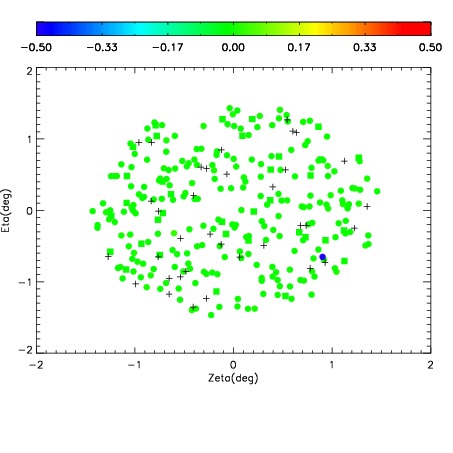
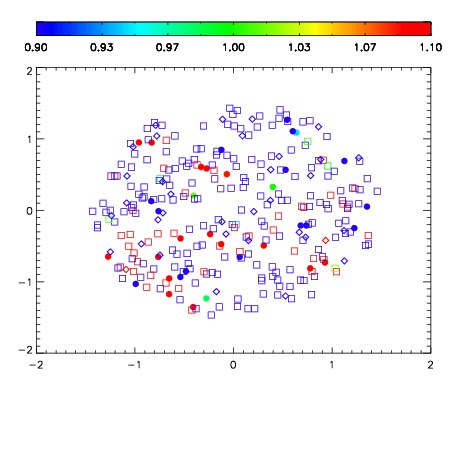
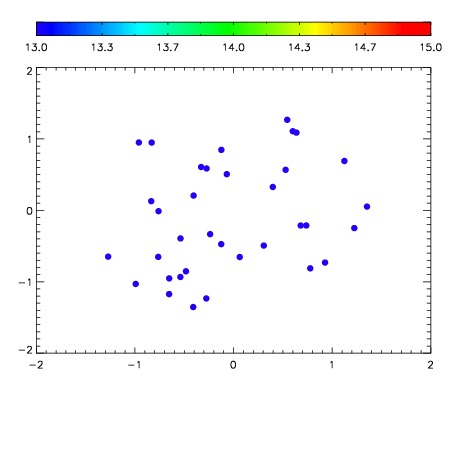

| Frame | Nreads | Zeropoints | Mag plots | Spatial mag deviation | Spatial sky 16325A emission deviations (filled: sky, open: star) | Spatial sky continuum emission | Spatial sky telluric CO2 absorption deviations (filled: H < 10) | |||||||||||||||||||||||
| 0 | 0 |
|
|
|
|
|
|
| IPAIR | NAME | SHIFT | NEWSHIFT | S/N | NAME | SHIFT | NEWSHIFT | S/N |
| 0 | 17330034 | 0.503423 | 0.00000 | 18.8562 | 17330033 | 0.00000 | 0.503423 | 18.8770 |
| 1 | 17330038 | 0.499651 | 0.00377196 | 19.0140 | 17330040 | 0.000480158 | 0.502943 | 19.0147 |
| 2 | 17330039 | 0.499495 | 0.00392798 | 19.0074 | 17330037 | 0.000468394 | 0.502955 | 19.0037 |
| 3 | 17330035 | 0.503242 | 0.000180960 | 18.9267 | 17330036 | 0.000523292 | 0.502900 | 18.9865 |