| Red | Green | Blue | |
| z | 17.64 | ||
| znorm | Inf | ||
| sky | -Inf | -Inf | -Inf |
| S/N | 33.5 | 55.4 | 62.1 |
| S/N(c) | 0.0 | 0.0 | 0.0 |
| SN(E/C) |
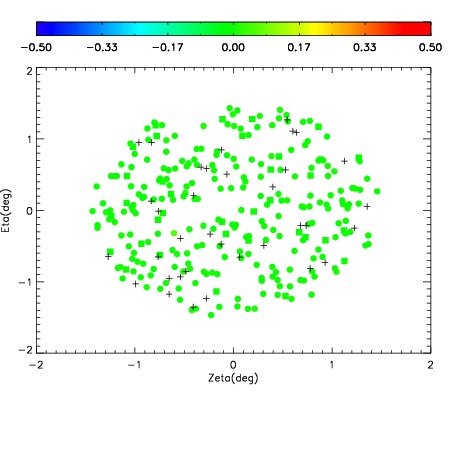
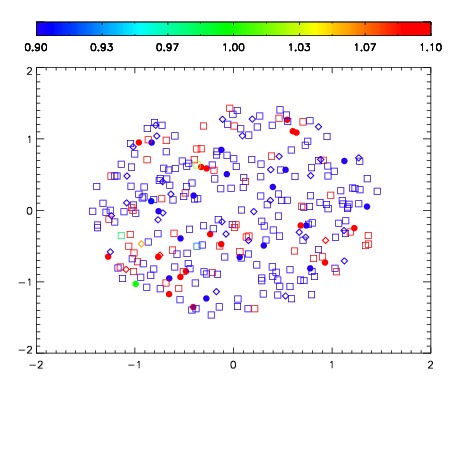
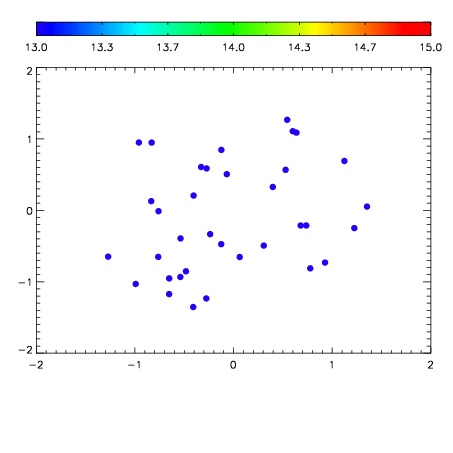

| Frame | Nreads | Zeropoints | Mag plots | Spatial mag deviation | Spatial sky 16325A emission deviations (filled: sky, open: star) | Spatial sky continuum emission | Spatial sky telluric CO2 absorption deviations (filled: H < 10) | |||||||||||||||||||||||
| 0 | 0 |
|
|
|
|
|
|
| IPAIR | NAME | SHIFT | NEWSHIFT | S/N | NAME | SHIFT | NEWSHIFT | S/N |
| 0 | 19950056 | 0.501348 | 0.00000 | 19.0875 | 19950057 | 0.00189422 | 0.499454 | 19.1091 |
| 1 | 19950052 | 0.499023 | 0.00232503 | 19.1526 | 19950050 | 0.00000 | 0.501348 | 19.1364 |
| 2 | 19950051 | 0.498371 | 0.00297701 | 19.1451 | 19950053 | 0.00352085 | 0.497827 | 19.1304 |
| 3 | 19950055 | 0.500677 | 0.000671029 | 19.0926 | 19950054 | 0.00326329 | 0.498085 | 19.1091 |