| Red | Green | Blue | |
| z | 17.64 | ||
| znorm | Inf | ||
| sky | -Inf | -Inf | -Inf |
| S/N | 19.3 | 33.4 | 36.1 |
| S/N(c) | 0.0 | 0.0 | 0.0 |
| SN(E/C) |
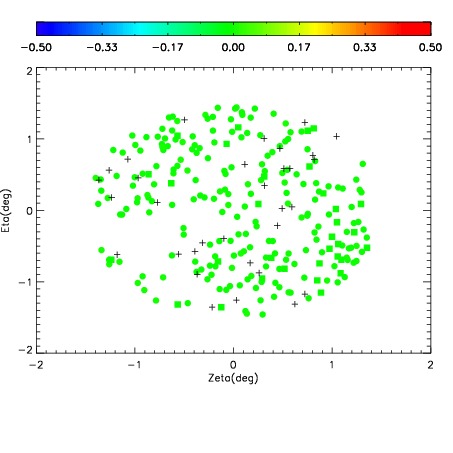
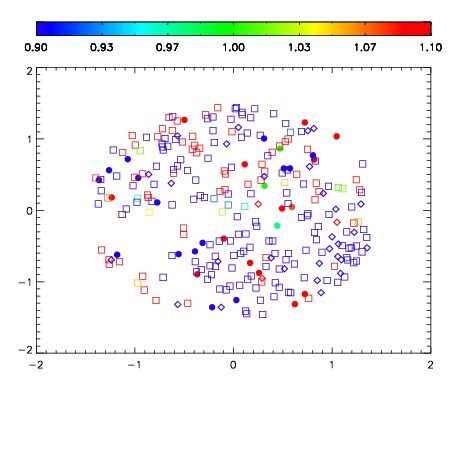
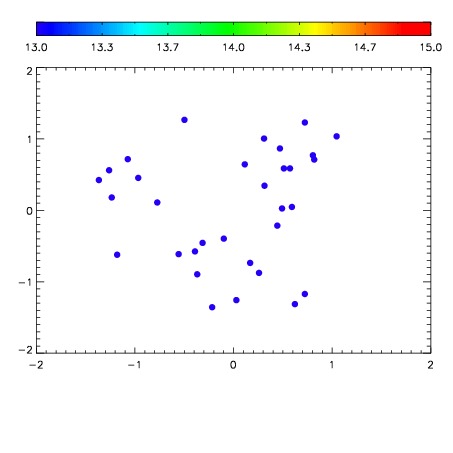

| Frame | Nreads | Zeropoints | Mag plots | Spatial mag deviation | Spatial sky 16325A emission deviations (filled: sky, open: star) | Spatial sky continuum emission | Spatial sky telluric CO2 absorption deviations (filled: H < 10) | |||||||||||||||||||||||
| 0 | 0 |
|
|
|
|
|
|
| IPAIR | NAME | SHIFT | NEWSHIFT | S/N | NAME | SHIFT | NEWSHIFT | S/N |
| 0 | 16160051 | 0.494823 | 0.00000 | 16.2940 | 16160052 | 0.00280701 | 0.492016 | 14.9754 |
| 1 | 16160050 | 0.492538 | 0.00228500 | 18.8408 | 16160049 | 0.000952209 | 0.493871 | 18.9373 |
| 2 | 16160047 | 0.492922 | 0.00190100 | 18.7145 | 16160045 | 0.00000 | 0.494823 | 18.8223 |
| 3 | 16160046 | 0.493086 | 0.00173700 | 18.1225 | 16160048 | 0.00126708 | 0.493556 | 18.6935 |