| Red | Green | Blue | |
| z | 17.63 | ||
| znorm | Inf | ||
| sky | -NaN | -NaN | -NaN |
| S/N | 30.1 | 47.8 | 53.3 |
| S/N(c) | 0.0 | 0.0 | 0.0 |
| SN(E/C) |

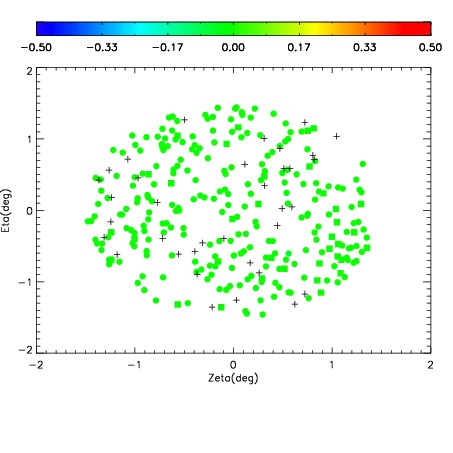
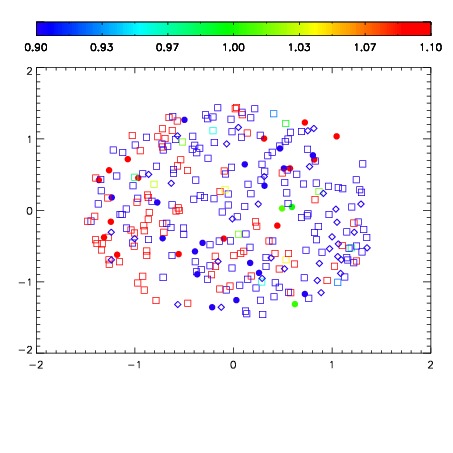
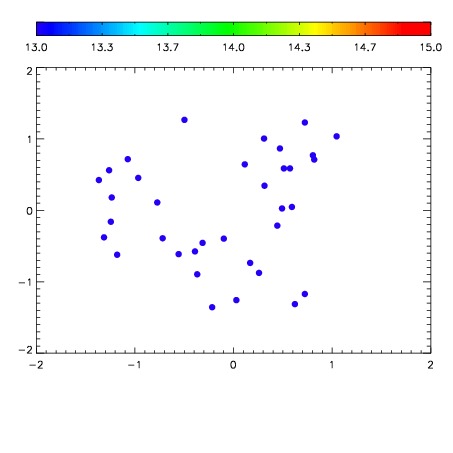

| Frame | Nreads | Zeropoints | Mag plots | Spatial mag deviation | Spatial sky 16325A emission deviations (filled: sky, open: star) | Spatial sky continuum emission | Spatial sky telluric CO2 absorption deviations (filled: H < 10) | |||||||||||||||||||||||
| 0 | 0 |
|
|
|
|
|
|
| IPAIR | NAME | SHIFT | NEWSHIFT | S/N | NAME | SHIFT | NEWSHIFT | S/N |
| 0 | 17270024 | 0.510467 | 0.00000 | 19.1875 | 17270022 | 0.00000 | 0.510467 | 19.1532 |
| 1 | 17270027 | 0.509543 | 0.000923991 | 19.1957 | 17270026 | 0.00181785 | 0.508649 | 19.1708 |
| 2 | 17270023 | 0.509798 | 0.000669003 | 19.1831 | 17270025 | 0.00229317 | 0.508174 | 19.1500 |
| 3 | 17270028 | 0.509824 | 0.000643015 | 19.1165 | 17270029 | 0.00352808 | 0.506939 | 17.2227 |