| Red | Green | Blue | |
| z | 17.64 | ||
| znorm | Inf | ||
| sky | -NaN | -NaN | -NaN |
| S/N | 30.7 | 50.6 | 55.2 |
| S/N(c) | 0.0 | 0.0 | 0.0 |
| SN(E/C) |
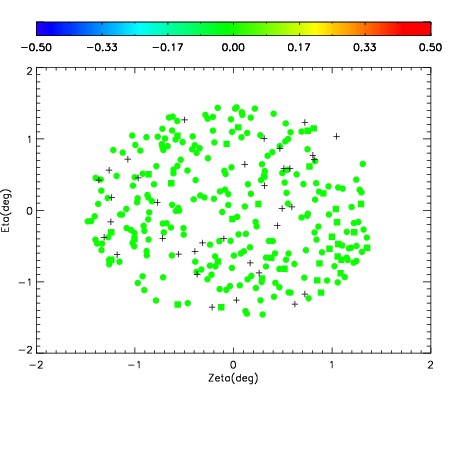
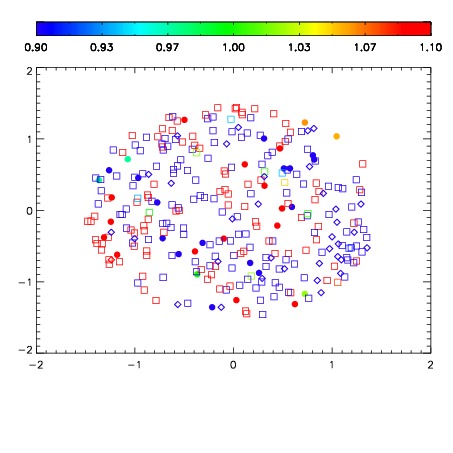
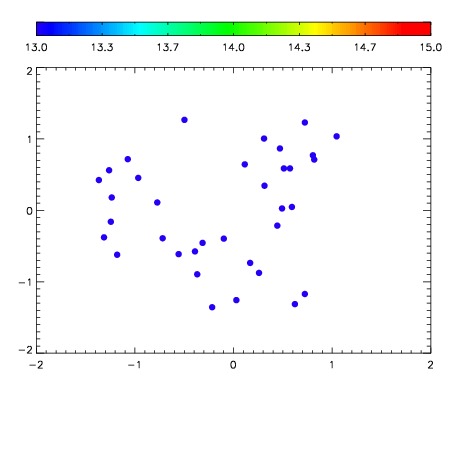

| Frame | Nreads | Zeropoints | Mag plots | Spatial mag deviation | Spatial sky 16325A emission deviations (filled: sky, open: star) | Spatial sky continuum emission | Spatial sky telluric CO2 absorption deviations (filled: H < 10) | |||||||||||||||||||||||
| 0 | 0 |
|
|
|
|
|
|
| IPAIR | NAME | SHIFT | NEWSHIFT | S/N | NAME | SHIFT | NEWSHIFT | S/N |
| 0 | 17310027 | 0.508584 | 0.00000 | 19.1498 | 17310028 | 0.00355296 | 0.505031 | 19.1689 |
| 1 | 17310026 | 0.507686 | 0.000898004 | 19.1262 | 17310025 | 0.00209400 | 0.506490 | 19.1016 |
| 2 | 17310022 | 0.504748 | 0.00383604 | 19.0564 | 17310024 | 0.00202208 | 0.506562 | 19.0662 |
| 3 | 17310023 | 0.505087 | 0.00349700 | 19.0487 | 17310021 | 0.00000 | 0.508584 | 19.0568 |