| Red | Green | Blue | |
| z | 17.64 | ||
| znorm | Inf | ||
| sky | -Inf | -Inf | -Inf |
| S/N | 24.9 | 42.1 | 48.2 |
| S/N(c) | 0.0 | 0.0 | 0.0 |
| SN(E/C) |

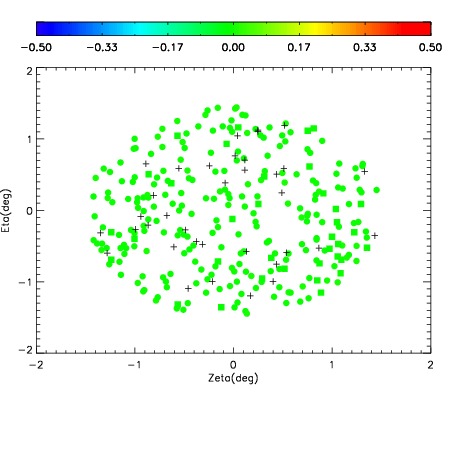

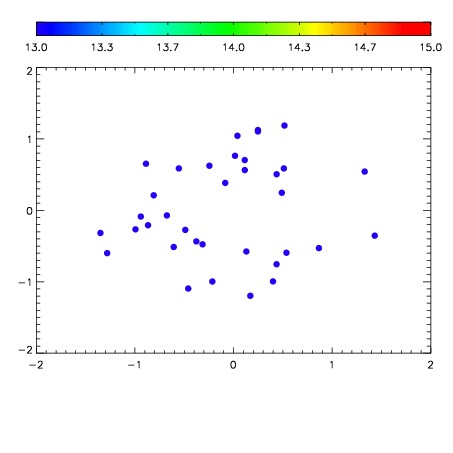

| Frame | Nreads | Zeropoints | Mag plots | Spatial mag deviation | Spatial sky 16325A emission deviations (filled: sky, open: star) | Spatial sky continuum emission | Spatial sky telluric CO2 absorption deviations (filled: H < 10) | |||||||||||||||||||||||
| 0 | 0 |
|
|
|
|
|
|
| IPAIR | NAME | SHIFT | NEWSHIFT | S/N | NAME | SHIFT | NEWSHIFT | S/N |
| 0 | 17340017 | 0.501601 | 0.00000 | 18.6646 | 17340014 | 0.000154608 | 0.501446 | 18.6631 |
| 1 | 17340013 | 0.500758 | 0.000842988 | 19.1051 | 17340015 | 0.000628364 | 0.500973 | 18.8929 |
| 2 | 17340012 | 0.500435 | 0.00116599 | 18.9958 | 17340018 | 0.000332702 | 0.501268 | 18.6956 |
| 3 | 17340016 | 0.500420 | 0.00118101 | 18.4273 | 17340011 | 0.00000 | 0.501601 | 18.6118 |