| Red | Green | Blue | |
| z | 17.64 | ||
| znorm | Inf | ||
| sky | -Inf | -Inf | -Inf |
| S/N | 29.8 | 47.8 | 52.9 |
| S/N(c) | 0.0 | 0.0 | 0.0 |
| SN(E/C) |
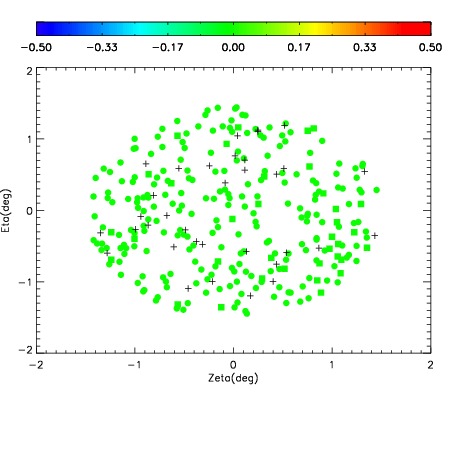
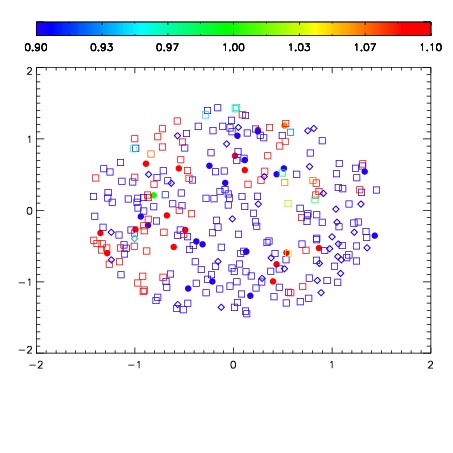


| Frame | Nreads | Zeropoints | Mag plots | Spatial mag deviation | Spatial sky 16325A emission deviations (filled: sky, open: star) | Spatial sky continuum emission | Spatial sky telluric CO2 absorption deviations (filled: H < 10) | |||||||||||||||||||||||
| 0 | 0 |
|
|
|
|
|
|
| IPAIR | NAME | SHIFT | NEWSHIFT | S/N | NAME | SHIFT | NEWSHIFT | S/N |
| 0 | 19740071 | 0.00101423 | 0.00000 | 18.9885 | 19740070 | -0.495862 | 0.496876 | 18.9136 |
| 1 | 19740067 | 0.000168908 | 0.000845322 | 19.0466 | 19740066 | -0.495969 | 0.496983 | 19.0389 |
| 2 | 19740064 | 0.00000 | 0.00101423 | 19.0037 | 19740065 | -0.496329 | 0.497343 | 19.0070 |
| 3 | 19740068 | 0.000402045 | 0.000612185 | 18.9653 | 19740069 | -0.495764 | 0.496778 | 18.8349 |