| Red | Green | Blue | |
| z | 17.64 | ||
| znorm | Inf | ||
| sky | -Inf | -Inf | -Inf |
| S/N | 19.0 | 35.7 | 37.1 |
| S/N(c) | 0.0 | 0.0 | 0.0 |
| SN(E/C) |
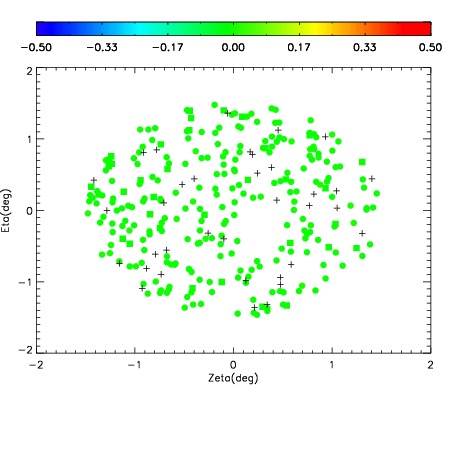
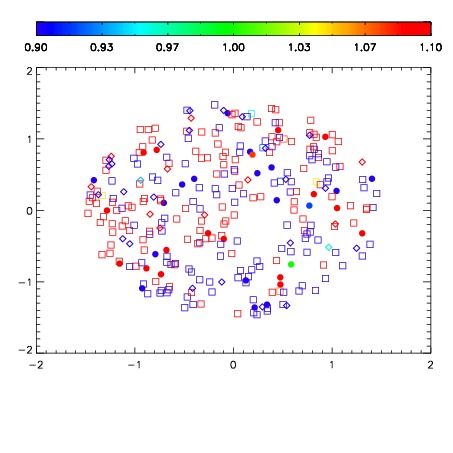
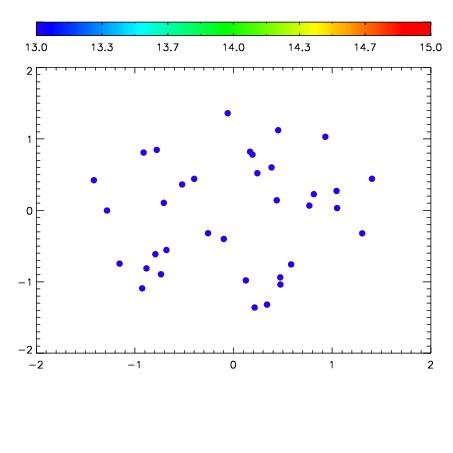

| Frame | Nreads | Zeropoints | Mag plots | Spatial mag deviation | Spatial sky 16325A emission deviations (filled: sky, open: star) | Spatial sky continuum emission | Spatial sky telluric CO2 absorption deviations (filled: H < 10) | |||||||||||||||||||||||
| 0 | 0 |
|
|
|
|
|
|
| IPAIR | NAME | SHIFT | NEWSHIFT | S/N | NAME | SHIFT | NEWSHIFT | S/N |
| 0 | 14590032 | 0.501121 | 0.00000 | 18.1495 | 14590030 | 0.00138808 | 0.499733 | 18.3728 |
| 1 | 14590027 | 0.497993 | 0.00312799 | 18.7281 | 14590026 | 0.00000 | 0.501121 | 18.6577 |
| 2 | 14590028 | 0.498294 | 0.00282699 | 18.6501 | 14590033 | 0.00158601 | 0.499535 | 18.5514 |
| 3 | 14590031 | 0.500186 | 0.000934958 | 18.3596 | 14590029 | 0.00133847 | 0.499783 | 18.5088 |