| Red | Green | Blue | |
| z | 17.64 | ||
| znorm | Inf | ||
| sky | -NaN | -NaN | -NaN |
| S/N | 20.2 | 35.5 | 41.5 |
| S/N(c) | 0.0 | 0.0 | 0.0 |
| SN(E/C) |
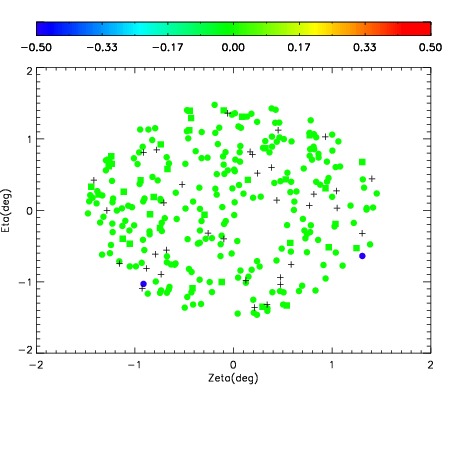
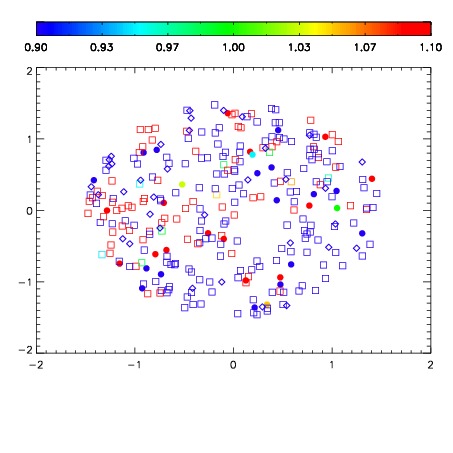
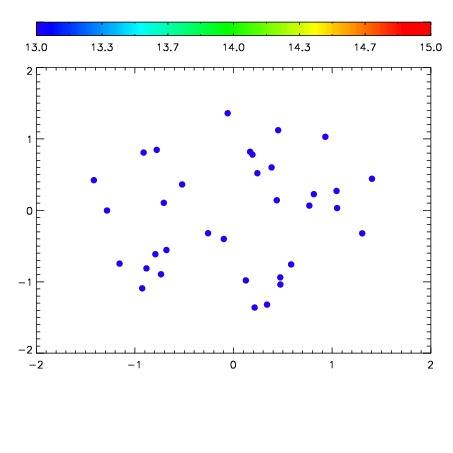

| Frame | Nreads | Zeropoints | Mag plots | Spatial mag deviation | Spatial sky 16325A emission deviations (filled: sky, open: star) | Spatial sky continuum emission | Spatial sky telluric CO2 absorption deviations (filled: H < 10) | |||||||||||||||||||||||
| 0 | 0 |
|
|
|
|
|
|
| IPAIR | NAME | SHIFT | NEWSHIFT | S/N | NAME | SHIFT | NEWSHIFT | S/N |
| 0 | 17010021 | 0.00156994 | 0.00000 | 18.2011 | 17010023 | -0.484293 | 0.485863 | 18.1613 |
| 1 | 17010018 | 0.00000 | 0.00156994 | 18.8098 | 17010019 | -0.484403 | 0.485973 | 18.8030 |
| 2 | 17010025 | 0.000313001 | 0.00125694 | 18.5645 | 17010024 | -0.485130 | 0.486700 | 18.6727 |
| 3 | 17010026 | 0.000125602 | 0.00144434 | 18.5331 | 17010020 | -0.484536 | 0.486106 | 18.6189 |
| 4 | 17010022 | 0.00136774 | 0.000202200 | 18.0519 | 17010027 | -0.486609 | 0.488179 | 17.0530 |