| Red | Green | Blue | |
| z | 17.64 | ||
| znorm | Inf | ||
| sky | -Inf | -Inf | -Inf |
| S/N | 25.9 | 44.4 | 47.8 |
| S/N(c) | 0.0 | 0.0 | 0.0 |
| SN(E/C) |
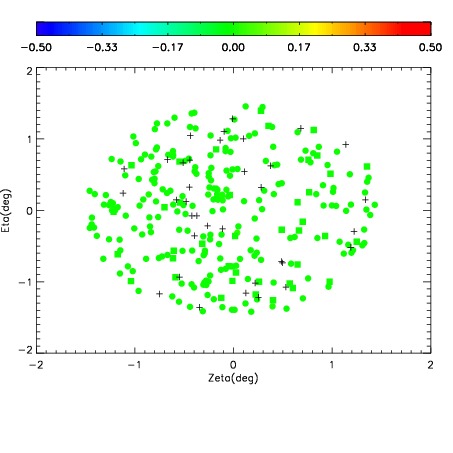
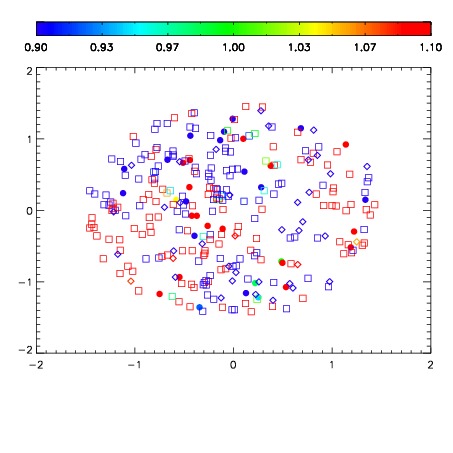
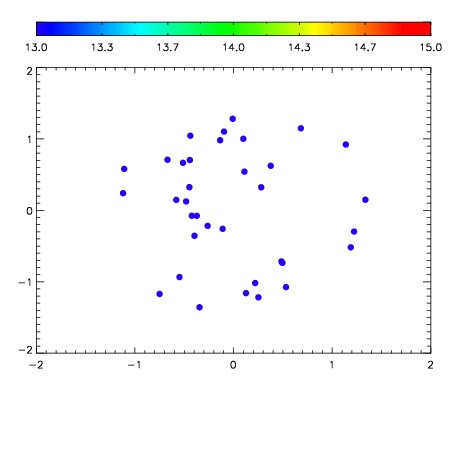

| Frame | Nreads | Zeropoints | Mag plots | Spatial mag deviation | Spatial sky 16325A emission deviations (filled: sky, open: star) | Spatial sky continuum emission | Spatial sky telluric CO2 absorption deviations (filled: H < 10) | |||||||||||||||||||||||
| 0 | 0 |
|
|
|
|
|
|
| IPAIR | NAME | SHIFT | NEWSHIFT | S/N | NAME | SHIFT | NEWSHIFT | S/N |
| 0 | 14300035 | 0.502433 | 0.00000 | 19.1438 | 14300036 | 0.000207820 | 0.502225 | 19.1274 |
| 1 | 14300034 | 0.501982 | 0.000451028 | 19.1110 | 14300037 | -0.000242768 | 0.502676 | 19.0730 |
| 2 | 14300039 | 0.502164 | 0.000268996 | 19.1089 | 14300040 | -0.000918021 | 0.503351 | 19.0553 |
| 3 | 14300038 | 0.502059 | 0.000374019 | 19.0667 | 14300033 | 0.00000 | 0.502433 | 19.0362 |