| Red | Green | Blue | |
| z | 17.64 | ||
| znorm | Inf | ||
| sky | -NaN | -NaN | -NaN |
| S/N | 27.6 | 48.2 | 52.7 |
| S/N(c) | 0.0 | 0.0 | 0.0 |
| SN(E/C) |
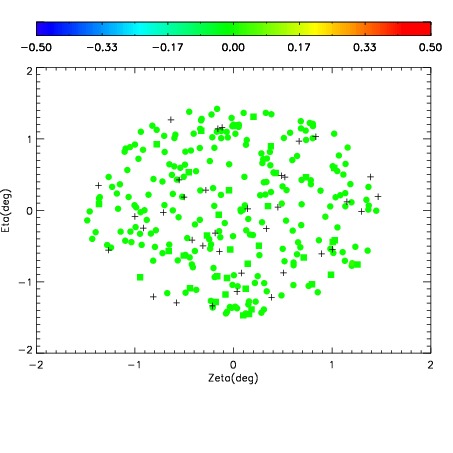
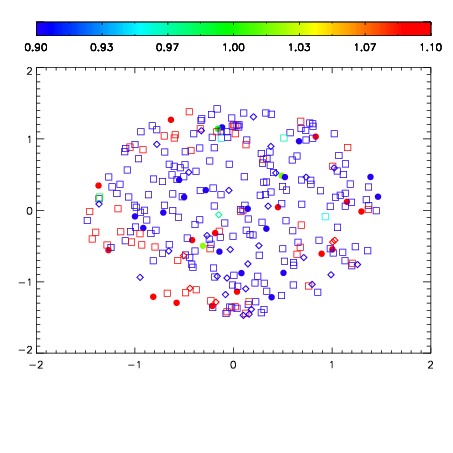
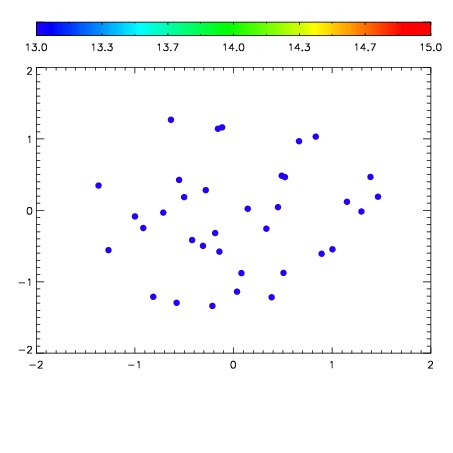

| Frame | Nreads | Zeropoints | Mag plots | Spatial mag deviation | Spatial sky 16325A emission deviations (filled: sky, open: star) | Spatial sky continuum emission | Spatial sky telluric CO2 absorption deviations (filled: H < 10) | |||||||||||||||||||||||
| 0 | 0 |
|
|
|
|
|
|
| IPAIR | NAME | SHIFT | NEWSHIFT | S/N | NAME | SHIFT | NEWSHIFT | S/N |
| 0 | 14060043 | 0.494946 | 0.00000 | 19.0439 | 14060042 | -0.00202490 | 0.496971 | 19.1294 |
| 1 | 14060044 | 0.494861 | 8.49962e-05 | 19.0872 | 14060041 | -0.00185555 | 0.496802 | 19.1431 |
| 2 | 14060040 | 0.494216 | 0.000730008 | 19.0621 | 14060038 | 0.00000 | 0.494946 | 19.1350 |
| 3 | 14060039 | 0.494112 | 0.000833988 | 18.9754 | 14060045 | -0.00230885 | 0.497255 | 19.0533 |