| Red | Green | Blue | |
| z | 17.64 | ||
| znorm | Inf | ||
| sky | -Inf | -NaN | -NaN |
| S/N | 28.3 | 48.7 | 53.4 |
| S/N(c) | 0.0 | 0.0 | 0.0 |
| SN(E/C) |
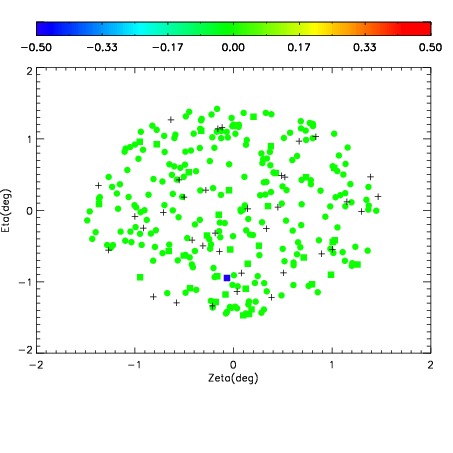
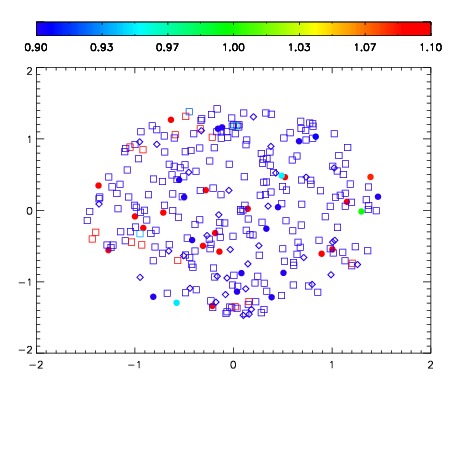


| Frame | Nreads | Zeropoints | Mag plots | Spatial mag deviation | Spatial sky 16325A emission deviations (filled: sky, open: star) | Spatial sky continuum emission | Spatial sky telluric CO2 absorption deviations (filled: H < 10) | |||||||||||||||||||||||
| 0 | 0 |
|
|
|
|
|
|
| IPAIR | NAME | SHIFT | NEWSHIFT | S/N | NAME | SHIFT | NEWSHIFT | S/N |
| 0 | 17090058 | 0.00348360 | 0.00000 | 19.1222 | 17090056 | -0.476082 | 0.479566 | 19.1239 |
| 1 | 17090061 | 0.00298669 | 0.000496910 | 19.1506 | 17090055 | -0.476129 | 0.479613 | 19.1693 |
| 2 | 17090054 | 0.00000 | 0.00348360 | 19.1384 | 17090060 | -0.477272 | 0.480756 | 19.1608 |
| 3 | 17090057 | 0.00345501 | 2.85900e-05 | 19.1134 | 17090059 | -0.475516 | 0.479000 | 19.1181 |