| Red | Green | Blue | |
| z | 17.64 | ||
| znorm | Inf | ||
| sky | -Inf | -Inf | -Inf |
| S/N | 25.9 | 42.3 | 50.7 |
| S/N(c) | 0.0 | 0.0 | 0.0 |
| SN(E/C) |
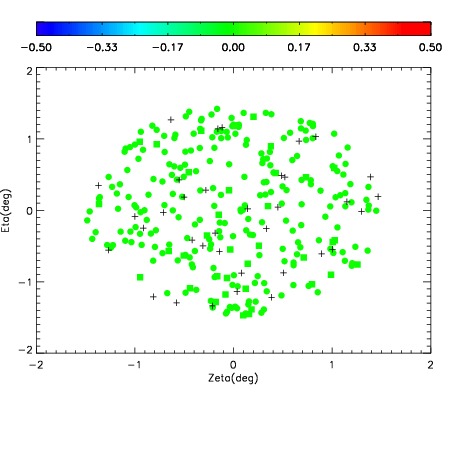
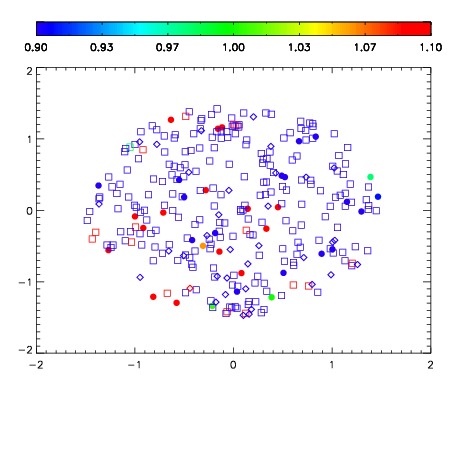
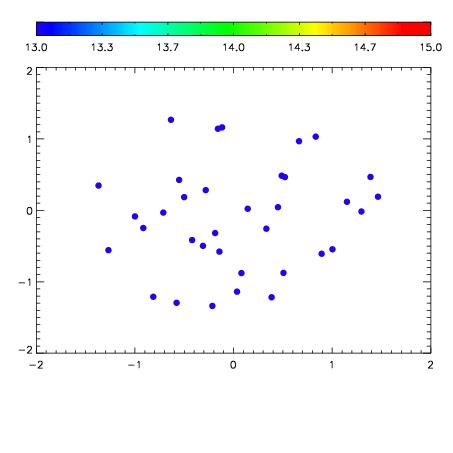

| Frame | Nreads | Zeropoints | Mag plots | Spatial mag deviation | Spatial sky 16325A emission deviations (filled: sky, open: star) | Spatial sky continuum emission | Spatial sky telluric CO2 absorption deviations (filled: H < 10) | |||||||||||||||||||||||
| 0 | 0 |
|
|
|
|
|
|
| IPAIR | NAME | SHIFT | NEWSHIFT | S/N | NAME | SHIFT | NEWSHIFT | S/N |
| 0 | 17330049 | 0.499129 | 0.00000 | 18.9606 | 17330048 | 0.00173849 | 0.497391 | 18.8811 |
| 1 | 17330050 | 0.496907 | 0.00222200 | 19.0419 | 17330051 | -0.00107643 | 0.500205 | 19.1528 |
| 2 | 17330045 | 0.498296 | 0.000833005 | 18.8282 | 17330047 | 0.00180221 | 0.497327 | 18.7929 |
| 3 | 17330046 | 0.498516 | 0.000613004 | 18.8275 | 17330044 | 0.00000 | 0.499129 | 18.7812 |