| Red | Green | Blue | |
| z | 17.64 | ||
| znorm | Inf | ||
| sky | -Inf | -Inf | -NaN |
| S/N | 19.3 | 35.3 | 40.3 |
| S/N(c) | 0.0 | 0.0 | 0.0 |
| SN(E/C) |
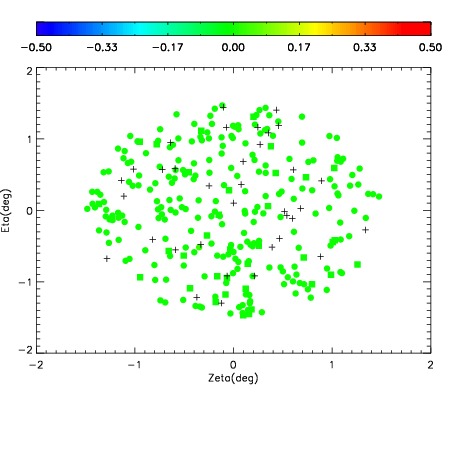
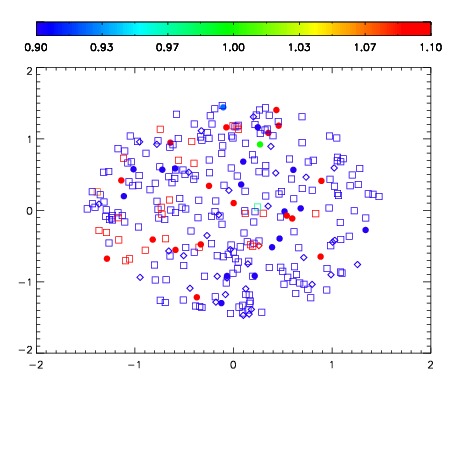
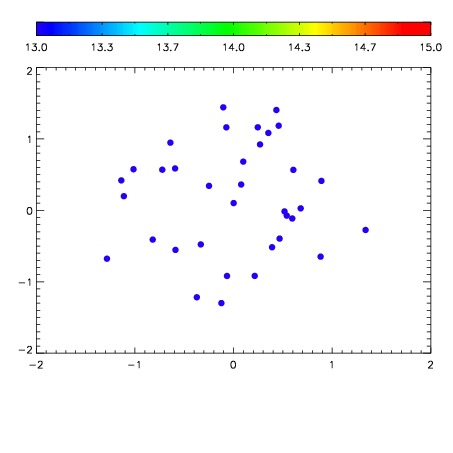

| Frame | Nreads | Zeropoints | Mag plots | Spatial mag deviation | Spatial sky 16325A emission deviations (filled: sky, open: star) | Spatial sky continuum emission | Spatial sky telluric CO2 absorption deviations (filled: H < 10) | |||||||||||||||||||||||
| 0 | 0 |
|
|
|
|
|
|
| IPAIR | NAME | SHIFT | NEWSHIFT | S/N | NAME | SHIFT | NEWSHIFT | S/N |
| 0 | 17340038 | 0.500957 | 0.00000 | 17.5743 | 17340040 | 0.000936407 | 0.500021 | 18.2995 |
| 1 | 17340039 | 0.499609 | 0.00134802 | 18.7613 | 17340037 | 0.00115908 | 0.499798 | 19.0465 |
| 2 | 17340035 | 0.500341 | 0.000616014 | 18.7420 | 17340033 | 0.00000 | 0.500957 | 18.8813 |
| 3 | 17340034 | 0.500287 | 0.000670016 | 18.7366 | 17340036 | 0.00232897 | 0.498628 | 18.8510 |