| Red | Green | Blue | |
| z | 17.64 | ||
| znorm | Inf | ||
| sky | -Inf | -Inf | -Inf |
| S/N | 31.4 | 50.2 | 55.0 |
| S/N(c) | 0.0 | 0.0 | 0.0 |
| SN(E/C) |

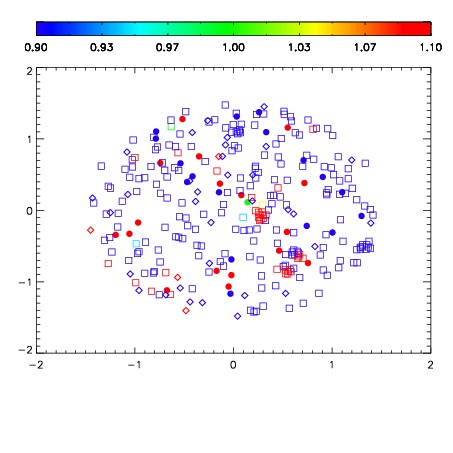
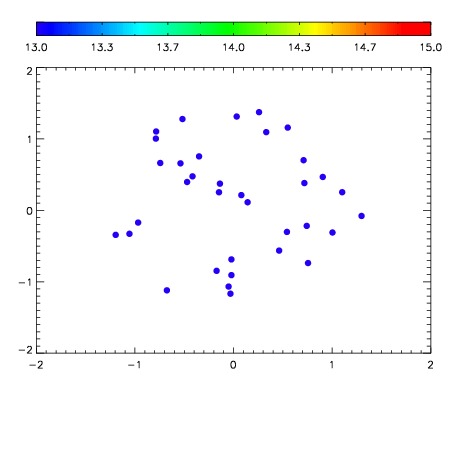

| Frame | Nreads | Zeropoints | Mag plots | Spatial mag deviation | Spatial sky 16325A emission deviations (filled: sky, open: star) | Spatial sky continuum emission | Spatial sky telluric CO2 absorption deviations (filled: H < 10) | |||||||||||||||||||||||
| 0 | 0 |
|
|
|
|
|
|
| IPAIR | NAME | SHIFT | NEWSHIFT | S/N | NAME | SHIFT | NEWSHIFT | S/N |
| 0 | 14280035 | 0.502438 | 0.00000 | 19.2359 | 14280033 | 0.00000 | 0.502438 | 19.2274 |
| 1 | 14280034 | 0.501283 | 0.00115502 | 19.2486 | 14280037 | -0.000221234 | 0.502659 | 19.2291 |
| 2 | 14280038 | 0.501793 | 0.000644982 | 19.2274 | 14280036 | -0.000339748 | 0.502778 | 19.2085 |
| 3 | 14280039 | 0.502204 | 0.000234008 | 19.1769 | 14280040 | -0.00116183 | 0.503600 | 19.1561 |