| Red | Green | Blue | |
| z | 17.64 | ||
| znorm | Inf | ||
| sky | -Inf | -Inf | -Inf |
| S/N | 19.6 | 34.3 | 38.3 |
| S/N(c) | 0.0 | 0.0 | 0.0 |
| SN(E/C) |
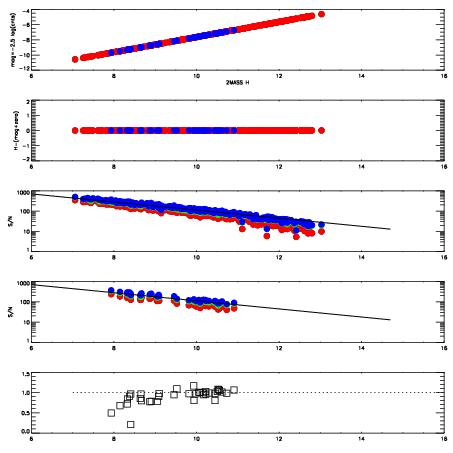
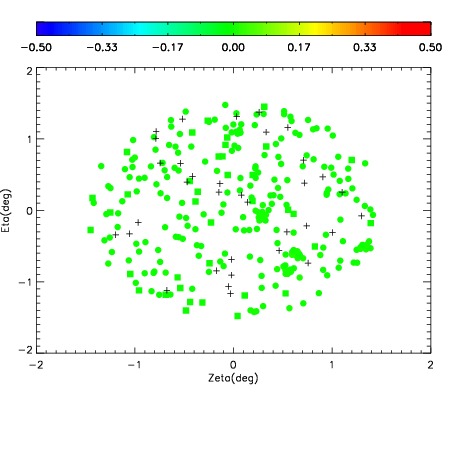
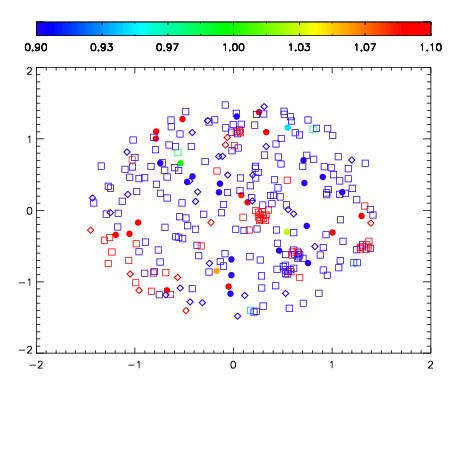


| Frame | Nreads | Zeropoints | Mag plots | Spatial mag deviation | Spatial sky 16325A emission deviations (filled: sky, open: star) | Spatial sky continuum emission | Spatial sky telluric CO2 absorption deviations (filled: H < 10) | |||||||||||||||||||||||
| 0 | 0 |
|
|
|
|
|
|
| IPAIR | NAME | SHIFT | NEWSHIFT | S/N | NAME | SHIFT | NEWSHIFT | S/N |
| 0 | 14310040 | 0.498316 | 0.00000 | 18.8393 | 14310038 | 0.00100071 | 0.497315 | 18.6712 |
| 1 | 14310039 | 0.497288 | 0.00102800 | 18.7911 | 14310041 | 0.000262203 | 0.498054 | 18.6399 |
| 2 | 14310036 | 0.497036 | 0.00127998 | 18.5818 | 14310037 | 0.000166204 | 0.498150 | 18.5939 |
| 3 | 14310035 | 0.496534 | 0.00178200 | 18.1327 | 14310034 | 0.00000 | 0.498316 | 17.8041 |