| Red | Green | Blue | |
| z | 17.64 | ||
| znorm | Inf | ||
| sky | -Inf | -Inf | -NaN |
| S/N | 31.7 | 51.7 | 56.8 |
| S/N(c) | 0.0 | 0.0 | 0.0 |
| SN(E/C) |
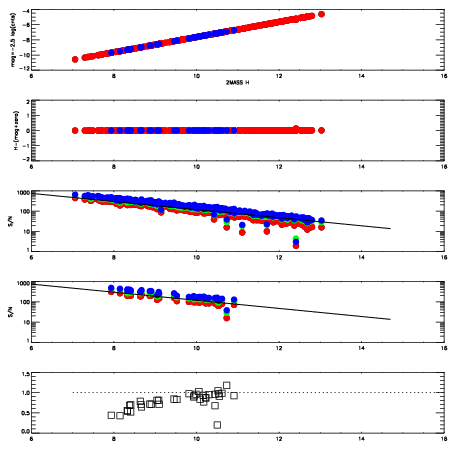
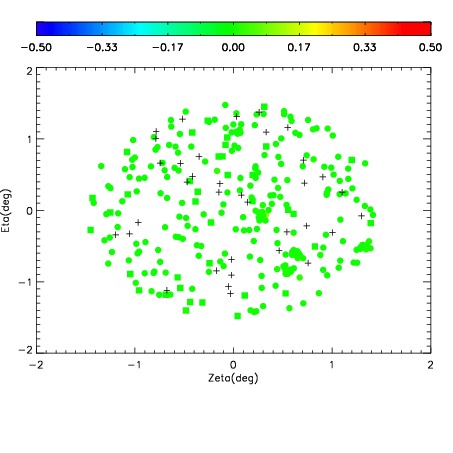
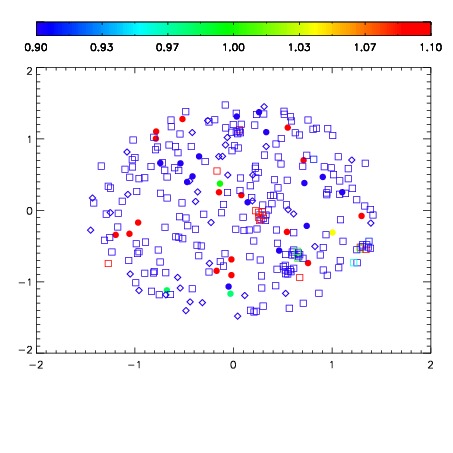
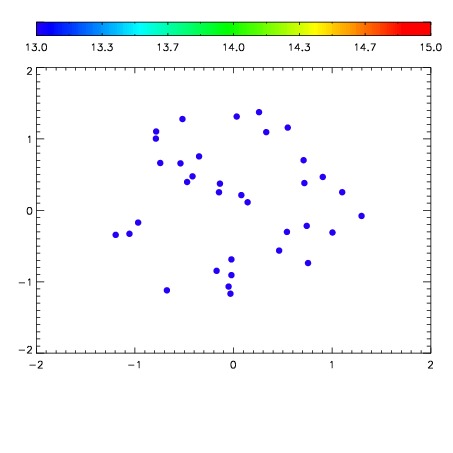

| Frame | Nreads | Zeropoints | Mag plots | Spatial mag deviation | Spatial sky 16325A emission deviations (filled: sky, open: star) | Spatial sky continuum emission | Spatial sky telluric CO2 absorption deviations (filled: H < 10) | |||||||||||||||||||||||
| 0 | 0 |
|
|
|
|
|
|
| IPAIR | NAME | SHIFT | NEWSHIFT | S/N | NAME | SHIFT | NEWSHIFT | S/N |
| 0 | 17310059 | 0.504716 | 0.00000 | 19.1684 | 17310054 | 0.00000 | 0.504716 | 19.1969 |
| 1 | 17310056 | 0.503436 | 0.00127995 | 19.2332 | 17310058 | 0.00272363 | 0.501992 | 19.2137 |
| 2 | 17310055 | 0.502725 | 0.00199097 | 19.2089 | 17310057 | 0.00263754 | 0.502078 | 19.2115 |
| 3 | 17310060 | 0.504147 | 0.000568986 | 19.0824 | 17310061 | 0.00389604 | 0.500820 | 18.9814 |