| Red | Green | Blue | |
| z | 17.64 | ||
| znorm | Inf | ||
| sky | -NaN | -Inf | -NaN |
| S/N | 27.6 | 43.6 | 51.6 |
| S/N(c) | 0.0 | 0.0 | 0.0 |
| SN(E/C) |
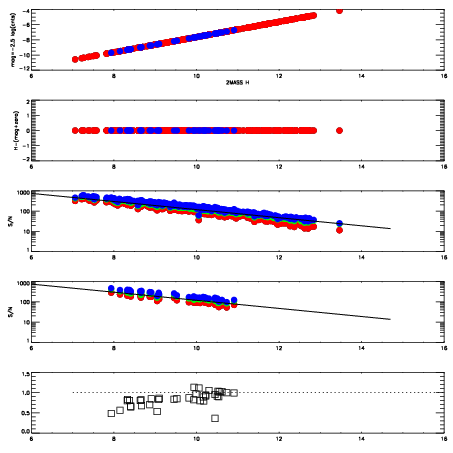
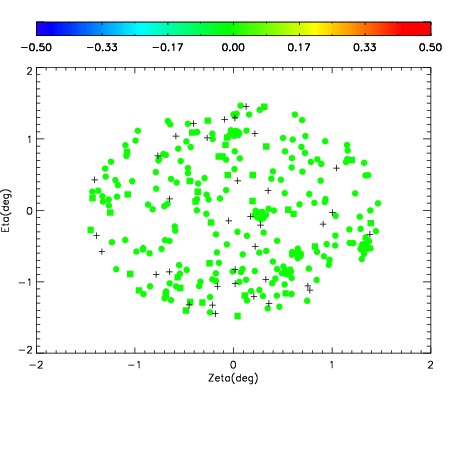
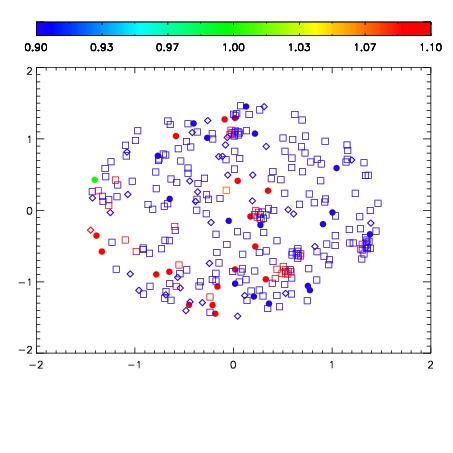
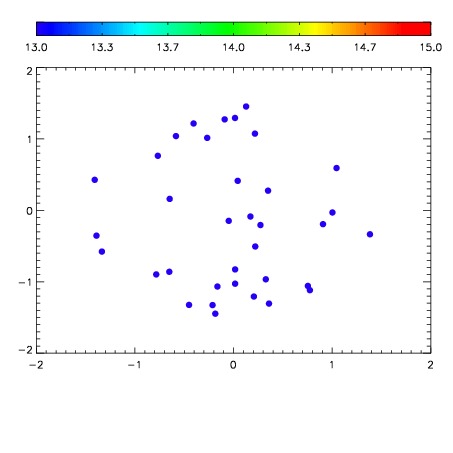

| Frame | Nreads | Zeropoints | Mag plots | Spatial mag deviation | Spatial sky 16325A emission deviations (filled: sky, open: star) | Spatial sky continuum emission | Spatial sky telluric CO2 absorption deviations (filled: H < 10) | |||||||||||||||||||||||
| 0 | 0 |
|
|
|
|
|
|
| IPAIR | NAME | SHIFT | NEWSHIFT | S/N | NAME | SHIFT | NEWSHIFT | S/N |
| 0 | 17320057 | 0.00000 | 0.00000 | 19.0991 | 17320058 | -0.507966 | 0.507966 | 19.1298 |
| 1 | 17320060 | -0.00437613 | 0.00437613 | 19.0812 | 17320059 | -0.508294 | 0.508294 | 19.1132 |
| 2 | 17320064 | -0.00592015 | 0.00592015 | 19.0642 | 17320063 | -0.508138 | 0.508138 | 19.0947 |
| 3 | 17320061 | -0.00386599 | 0.00386599 | 18.9974 | 17320062 | -0.507460 | 0.507460 | 19.0240 |