| Red | Green | Blue | |
| z | 17.64 | ||
| znorm | Inf | ||
| sky | -NaN | -NaN | -Inf |
| S/N | 34.2 | 52.0 | 61.8 |
| S/N(c) | 0.0 | 0.0 | 0.0 |
| SN(E/C) |
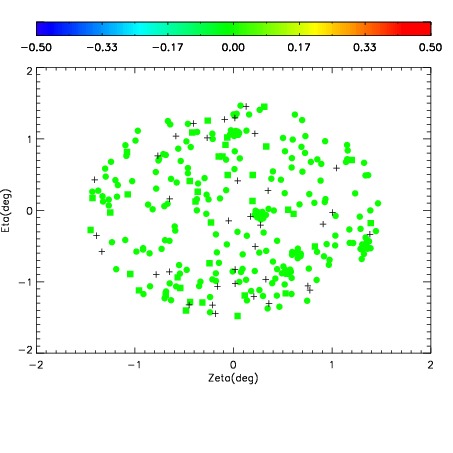
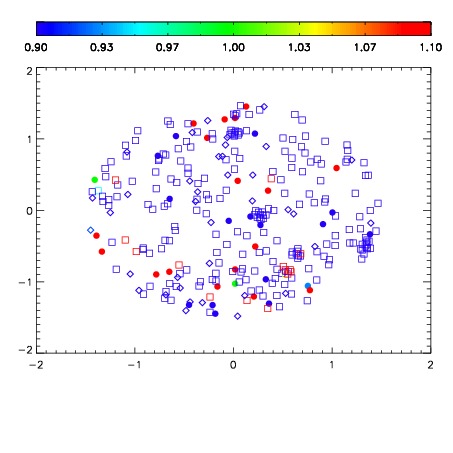


| Frame | Nreads | Zeropoints | Mag plots | Spatial mag deviation | Spatial sky 16325A emission deviations (filled: sky, open: star) | Spatial sky continuum emission | Spatial sky telluric CO2 absorption deviations (filled: H < 10) | |||||||||||||||||||||||
| 0 | 0 |
|
|
|
|
|
|
| IPAIR | NAME | SHIFT | NEWSHIFT | S/N | NAME | SHIFT | NEWSHIFT | S/N |
| 0 | 17350047 | 0.00478719 | 0.00000 | 19.1563 | 17350048 | -0.492943 | 0.497730 | 19.1712 |
| 1 | 17350042 | 0.00411180 | 0.000675390 | 19.1748 | 17350044 | -0.493214 | 0.498001 | 19.1797 |
| 2 | 17350046 | 0.00449275 | 0.000294440 | 19.1703 | 17350045 | -0.492989 | 0.497776 | 19.1749 |
| 3 | 17350039 | 0.00000 | 0.00478719 | 19.1483 | 17350041 | -0.490233 | 0.495020 | 19.1592 |
| 4 | 17350043 | 0.00403002 | 0.000757170 | 19.1309 | 17350040 | -0.490376 | 0.495163 | 19.1409 |